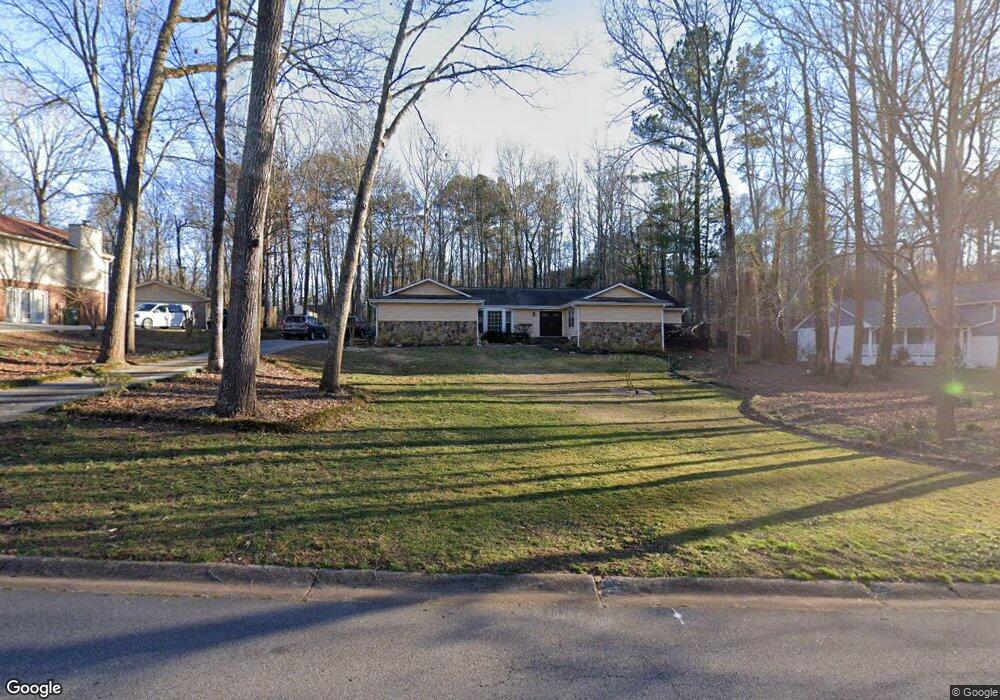
516 Westbridge Dr Fayetteville, GA 30214
Estimated Value: $301,585 - $405,000
--
Bed
2
Baths
1,952
Sq Ft
$179/Sq Ft
Est. Value
About This Home
This home is located at 516 Westbridge Dr, Fayetteville, GA 30214 and is currently estimated at $348,646, approximately $178 per square foot. 516 Westbridge Dr is a home located in Fayette County with nearby schools including North Fayette Elementary School, Flat Rock Middle School, and Sandy Creek High School.
Ownership History
Date
Name
Owned For
Owner Type
Purchase Details
Closed on
Sep 29, 2009
Sold by
Hud-Housing Of Urban Dev
Bought by
Mason Tom G
Current Estimated Value
Purchase Details
Closed on
Nov 14, 2008
Sold by
Jones Michelle
Bought by
Us Bank Na Trust 2006-Rf4
Purchase Details
Closed on
Nov 4, 2008
Sold by
Us Bank Na Trust 2006-Rf4
Bought by
Hud-Housing Of Urban Dev
Purchase Details
Closed on
Apr 28, 2000
Sold by
Dowdy Brenda
Bought by
Jones Michelle
Home Financials for this Owner
Home Financials are based on the most recent Mortgage that was taken out on this home.
Original Mortgage
$132,254
Interest Rate
8.2%
Mortgage Type
FHA
Purchase Details
Closed on
Jun 25, 1993
Sold by
Hannan Robert C Cathe
Bought by
Dowdy Brenda
Home Financials for this Owner
Home Financials are based on the most recent Mortgage that was taken out on this home.
Original Mortgage
$92,700
Interest Rate
7.52%
Mortgage Type
FHA
Create a Home Valuation Report for This Property
The Home Valuation Report is an in-depth analysis detailing your home's value as well as a comparison with similar homes in the area
Home Values in the Area
Average Home Value in this Area
Purchase History
| Date | Buyer | Sale Price | Title Company |
|---|---|---|---|
| Mason Tom G | -- | -- | |
| Us Bank Na Trust 2006-Rf4 | $159,672 | -- | |
| Hud-Housing Of Urban Dev | -- | -- | |
| Jones Michelle | $134,000 | -- | |
| Dowdy Brenda | $95,000 | -- |
Source: Public Records
Mortgage History
| Date | Status | Borrower | Loan Amount |
|---|---|---|---|
| Previous Owner | Jones Michelle | $132,254 | |
| Previous Owner | Dowdy Brenda | $92,700 |
Source: Public Records
Tax History Compared to Growth
Tax History
| Year | Tax Paid | Tax Assessment Tax Assessment Total Assessment is a certain percentage of the fair market value that is determined by local assessors to be the total taxable value of land and additions on the property. | Land | Improvement |
|---|---|---|---|---|
| 2024 | $996 | $130,036 | $24,000 | $106,036 |
| 2023 | $837 | $109,000 | $24,000 | $85,000 |
| 2022 | $876 | $104,600 | $24,000 | $80,600 |
| 2021 | $866 | $91,800 | $24,000 | $67,800 |
| 2020 | $1,314 | $71,560 | $11,200 | $60,360 |
| 2019 | $1,058 | $56,800 | $11,200 | $45,600 |
| 2018 | $1,004 | $53,440 | $11,200 | $42,240 |
| 2017 | $906 | $47,840 | $11,200 | $36,640 |
| 2016 | $834 | $42,880 | $11,200 | $31,680 |
| 2015 | $788 | $39,760 | $11,200 | $28,560 |
| 2014 | $1,039 | $36,240 | $11,200 | $25,040 |
| 2013 | -- | $36,240 | $0 | $0 |
Source: Public Records
Map
Nearby Homes
- 535 Westbridge Dr
- 849 Wagon Wheel Cir
- 919 Kite Lake Trail
- 150 Gadson Dr
- 405 Fairfield Cir
- 215 Gadson Dr
- 235 Gadson Dr
- 245 Gadson Dr
- 165 Standing Oak Place
- 2725 Old Jonesboro Rd
- 7637 Rudder Cir
- 3503 Ebb Cir
- 280 Benjamin Cir
- 313 Wagon Wheel Trail
- 105 Benson Cir
- 178 Westbridge Rd
- 7727 Volion Dr
- 7610 Crawford Ct
- 130 Benjamin Cir
- 7801 Flyaway Rd
- 514 Westbridge Dr
- 518 Westbridge Dr Unit 13C
- 518 Westbridge Dr
- 520 Westbridge Dr Unit 227
- 520 Westbridge Dr
- 512 Westbridge Dr
- 521 Westbridge Dr
- 521 Westbridge Dr
- 823 Covered Bridge Way Unit 41C
- 823 Covered Bridge Way
- 821 Covered Bridge Way Unit 42C
- 821 Covered Bridge Way
- 510 Westbridge Dr
- 519 Westbridge Dr Unit 1
- 522 Westbridge Dr Unit 1
- 523 Westbridge Dr
- 819 Covered Bridge Way
- 517 Westbridge Dr
- 825 Covered Bridge Way Unit 1
- 817 Covered Bridge Way