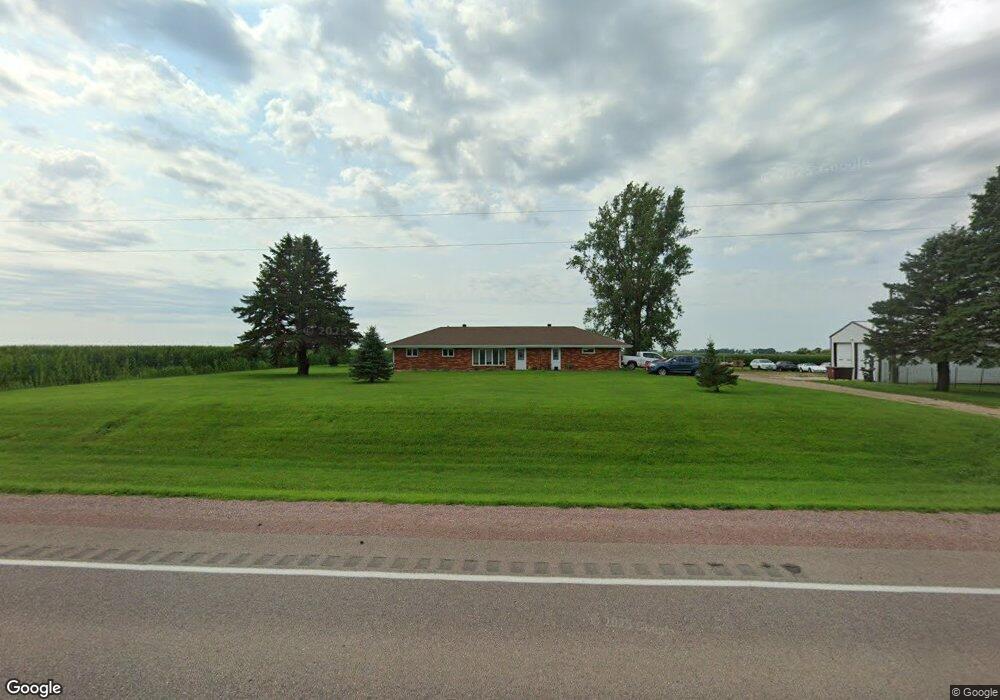
5161 320th St Sheldon, IA 51201
Estimated Value: $209,000 - $398,160
3
Beds
1
Bath
1,194
Sq Ft
$275/Sq Ft
Est. Value
About This Home
This home is located at 5161 320th St, Sheldon, IA 51201 and is currently estimated at $328,290, approximately $274 per square foot. 5161 320th St is a home located in O'Brien County with nearby schools including East Elementary School, Sheldon Middle School, and Sheldon High School.
Ownership History
Date
Name
Owned For
Owner Type
Purchase Details
Closed on
Dec 7, 2016
Sold by
Vankekerix Kenneth L and Van Kekerix Lisa A
Bought by
Smith Jason W and Smith Julie A
Current Estimated Value
Home Financials for this Owner
Home Financials are based on the most recent Mortgage that was taken out on this home.
Original Mortgage
$160,000
Outstanding Balance
$129,277
Interest Rate
3.54%
Mortgage Type
New Conventional
Estimated Equity
$199,013
Create a Home Valuation Report for This Property
The Home Valuation Report is an in-depth analysis detailing your home's value as well as a comparison with similar homes in the area
Purchase History
| Date | Buyer | Sale Price | Title Company |
|---|---|---|---|
| Smith Jason W | $200,000 | None Available |
Source: Public Records
Mortgage History
| Date | Status | Borrower | Loan Amount |
|---|---|---|---|
| Open | Smith Jason W | $160,000 |
Source: Public Records
Tax History
| Year | Tax Paid | Tax Assessment Tax Assessment Total Assessment is a certain percentage of the fair market value that is determined by local assessors to be the total taxable value of land and additions on the property. | Land | Improvement |
|---|---|---|---|---|
| 2025 | $2,244 | $277,240 | $11,140 | $266,100 |
| 2024 | $2,244 | $205,770 | $8,560 | $197,210 |
| 2023 | $2,180 | $205,770 | $8,560 | $197,210 |
| 2022 | $1,534 | $138,510 | $6,440 | $132,070 |
| 2021 | $1,534 | $139,020 | $6,950 | $132,070 |
| 2020 | $1,408 | $124,280 | $6,900 | $117,380 |
| 2019 | $1,346 | $123,470 | $0 | $0 |
| 2018 | $1,332 | $123,470 | $0 | $0 |
| 2017 | $1,194 | $90,390 | $0 | $0 |
| 2016 | $1,248 | $90,390 | $0 | $0 |
| 2015 | $1,248 | $120,920 | $0 | $0 |
| 2014 | $1,776 | $120,920 | $0 | $0 |
Source: Public Records
Map
Nearby Homes
Your Personal Tour Guide
Ask me questions while you tour the home.