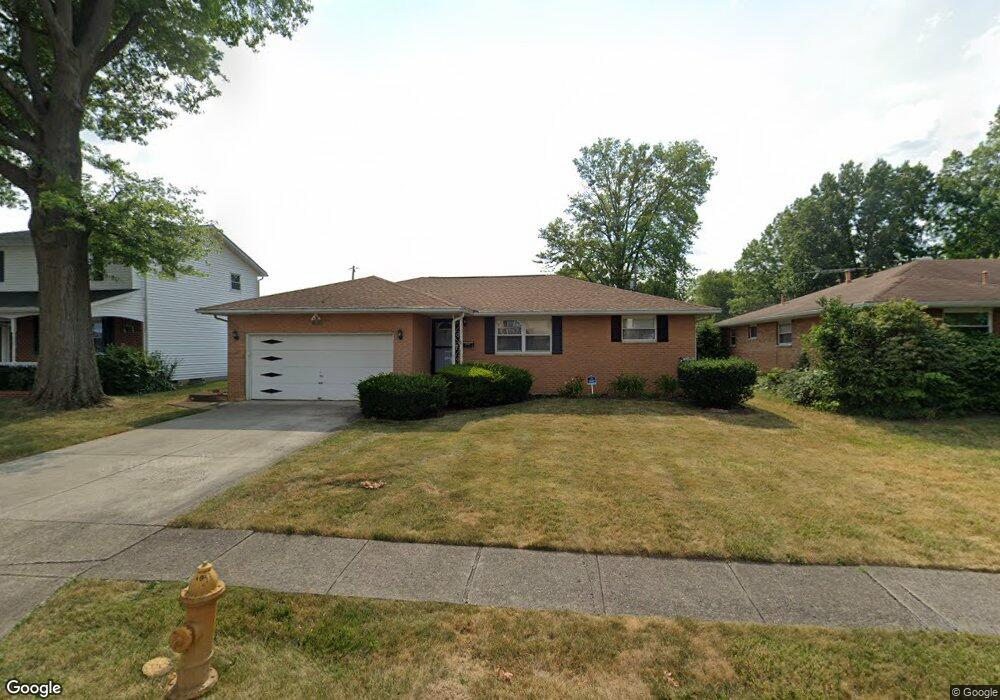
5161 Northcliff Loop W Columbus, OH 43229
Forest Park East NeighborhoodEstimated Value: $281,152 - $304,000
3
Beds
2
Baths
1,486
Sq Ft
$197/Sq Ft
Est. Value
About This Home
This home is located at 5161 Northcliff Loop W, Columbus, OH 43229 and is currently estimated at $293,038, approximately $197 per square foot. 5161 Northcliff Loop W is a home located in Franklin County with nearby schools including Parkmoor Elementary School, Woodward Park Middle School, and Northland High School.
Ownership History
Date
Name
Owned For
Owner Type
Purchase Details
Closed on
Jun 21, 2004
Sold by
Forte Josephine and Forte Joseph A
Bought by
Smith D John and Bush Bernice M
Current Estimated Value
Home Financials for this Owner
Home Financials are based on the most recent Mortgage that was taken out on this home.
Original Mortgage
$128,250
Interest Rate
6.37%
Mortgage Type
Purchase Money Mortgage
Purchase Details
Closed on
May 20, 2004
Sold by
Estate Of Rita Trapasso
Bought by
Forte Josephine
Home Financials for this Owner
Home Financials are based on the most recent Mortgage that was taken out on this home.
Original Mortgage
$128,250
Interest Rate
6.37%
Mortgage Type
Purchase Money Mortgage
Purchase Details
Closed on
Apr 20, 2004
Sold by
Estate Of Raymond D Trapasso
Bought by
Trapasso Rita
Purchase Details
Closed on
Apr 16, 1976
Bought by
Trapasso Rita C
Create a Home Valuation Report for This Property
The Home Valuation Report is an in-depth analysis detailing your home's value as well as a comparison with similar homes in the area
Home Values in the Area
Average Home Value in this Area
Purchase History
| Date | Buyer | Sale Price | Title Company |
|---|---|---|---|
| Smith D John | $135,000 | Columbus Title | |
| Forte Josephine | -- | -- | |
| Trapasso Rita | -- | -- | |
| Trapasso Rita C | -- | -- |
Source: Public Records
Mortgage History
| Date | Status | Borrower | Loan Amount |
|---|---|---|---|
| Previous Owner | Smith D John | $128,250 |
Source: Public Records
Tax History Compared to Growth
Tax History
| Year | Tax Paid | Tax Assessment Tax Assessment Total Assessment is a certain percentage of the fair market value that is determined by local assessors to be the total taxable value of land and additions on the property. | Land | Improvement |
|---|---|---|---|---|
| 2024 | $3,417 | $85,930 | $21,530 | $64,400 |
| 2023 | $3,401 | $85,930 | $21,530 | $64,400 |
| 2022 | $2,435 | $55,690 | $13,020 | $42,670 |
| 2021 | $2,439 | $55,690 | $13,020 | $42,670 |
| 2020 | $2,442 | $55,690 | $13,020 | $42,670 |
| 2019 | $1,930 | $40,570 | $9,660 | $30,910 |
| 2018 | $1,910 | $40,570 | $9,660 | $30,910 |
| 2017 | $1,929 | $40,570 | $9,660 | $30,910 |
| 2016 | $2,087 | $40,250 | $9,030 | $31,220 |
| 2015 | $1,894 | $40,250 | $9,030 | $31,220 |
| 2014 | $1,899 | $40,250 | $9,030 | $31,220 |
| 2013 | $1,000 | $42,385 | $9,520 | $32,865 |
Source: Public Records
Map
Nearby Homes
- 5124 Northcliff Loop W
- 1704 Riverbirch Dr
- 2058 Northcliff Dr
- 5204 Honeytree Loop W
- 5056 Northtowne Blvd Unit 5054
- 5231 Arrowood Ct
- 5022 Sienna Ln
- 2158 Kilbourne Ave
- 2033 Brittany Rd
- 5485 Tamarack Blvd
- 2166 Waldorf Rd
- 1493 Boxwood Dr
- 4849 Heatherton Dr
- 4885 Northtowne Blvd
- 2134 Trent Rd
- 1914 Walden Dr
- 1722 Blue Ash Place
- 4923 Karl Rd Unit 4925
- 4714 Ascot Dr
- 1485 Norma Rd
- 5153 Northcliff Loop W
- 5169 Northcliff Loop W
- 5181 Northcliff Loop W
- 5168 Tamarack Blvd
- 5145 Northcliff Loop W
- 5176 Tamarack Blvd
- 5156 Tamarack Blvd
- 5184 Tamarack Blvd
- 5158 Northcliff Loop W
- 5150 Northcliff Loop W
- 5166 Northcliff Loop W
- 5148 Tamarack Blvd
- 5135 Northcliff Loop W
- 5187 Northcliff Loop W
- 5174 Northcliff Loop N
- 5144 Northcliff Loop W
- 5174 Northcliff Loop W
- 5192 Tamarack Blvd
- 5140 Tamarack Blvd
- 5132 Northcliff Loop W