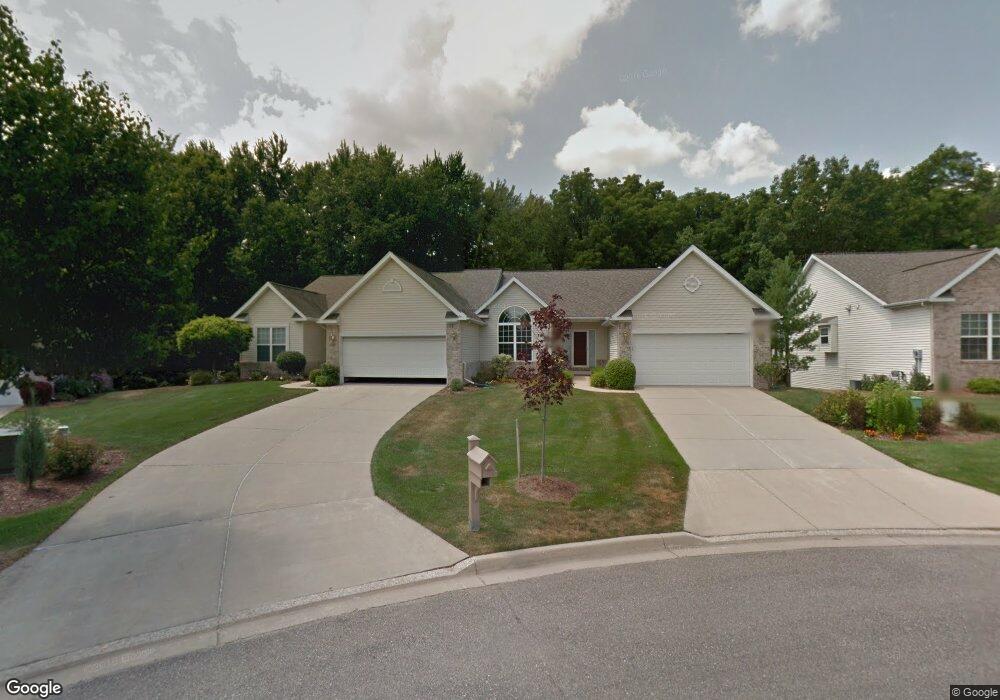
5163 Sapphire Cir Unit 26 East Lansing, MI 48823
Estimated Value: $398,000 - $494,000
2
Beds
3
Baths
1,588
Sq Ft
$278/Sq Ft
Est. Value
About This Home
This home is located at 5163 Sapphire Cir Unit 26, East Lansing, MI 48823 and is currently estimated at $440,687, approximately $277 per square foot. 5163 Sapphire Cir Unit 26 is a home located in Ingham County with nearby schools including Bennett Woods Elementary School, Kinawa School, and Chippewa Middle School.
Ownership History
Date
Name
Owned For
Owner Type
Purchase Details
Closed on
May 20, 2021
Sold by
Fielder Donald H and Fielder Carolyn G
Bought by
Fielder Donald H and Fielder Carolyn G
Current Estimated Value
Purchase Details
Closed on
Oct 30, 2002
Sold by
Hahn Chelsea Y
Bought by
Fielder Donald H and Fielder Carolyn G
Home Financials for this Owner
Home Financials are based on the most recent Mortgage that was taken out on this home.
Original Mortgage
$125,000
Outstanding Balance
$45,019
Interest Rate
4.12%
Mortgage Type
Purchase Money Mortgage
Estimated Equity
$395,668
Purchase Details
Closed on
Mar 9, 2001
Sold by
Sapphire Lakes Development Llc
Bought by
Hahn Chelsea Y
Home Financials for this Owner
Home Financials are based on the most recent Mortgage that was taken out on this home.
Original Mortgage
$165,000
Interest Rate
8.12%
Mortgage Type
Purchase Money Mortgage
Create a Home Valuation Report for This Property
The Home Valuation Report is an in-depth analysis detailing your home's value as well as a comparison with similar homes in the area
Home Values in the Area
Average Home Value in this Area
Purchase History
| Date | Buyer | Sale Price | Title Company |
|---|---|---|---|
| Fielder Donald H | -- | None Available | |
| Fielder Donald H | $270,000 | Trans | |
| Hahn Chelsea Y | $250,000 | Midstate Title Company |
Source: Public Records
Mortgage History
| Date | Status | Borrower | Loan Amount |
|---|---|---|---|
| Open | Fielder Donald H | $125,000 | |
| Previous Owner | Hahn Chelsea Y | $165,000 | |
| Closed | Fielder Donald H | $91,000 |
Source: Public Records
Tax History Compared to Growth
Tax History
| Year | Tax Paid | Tax Assessment Tax Assessment Total Assessment is a certain percentage of the fair market value that is determined by local assessors to be the total taxable value of land and additions on the property. | Land | Improvement |
|---|---|---|---|---|
| 2025 | $6,646 | $204,300 | $45,000 | $159,300 |
| 2024 | $29 | $195,100 | $42,500 | $152,600 |
| 2023 | $6,172 | $156,800 | $42,000 | $114,800 |
| 2022 | $6,058 | $155,300 | $40,000 | $115,300 |
| 2021 | $5,834 | $146,000 | $36,200 | $109,800 |
| 2020 | $5,664 | $140,600 | $36,200 | $104,400 |
| 2019 | $5,530 | $125,800 | $32,800 | $93,000 |
| 2018 | $5,249 | $112,800 | $35,600 | $77,200 |
| 2017 | $4,993 | $114,200 | $34,900 | $79,300 |
| 2016 | $2,230 | $112,900 | $37,000 | $75,900 |
| 2015 | $2,230 | $104,300 | $58,500 | $45,800 |
| 2014 | $2,230 | $98,700 | $53,900 | $44,800 |
Source: Public Records
Map
Nearby Homes
- 5159 Sapphire Cir Unit 27
- 5167 Sapphire Cir Unit 25
- 5162 Sapphire Cir Unit 31
- 2343 Sapphire Ln Unit 48
- 5283 E Hidden Lake Dr Unit 47
- 2216 Iroquois Rd
- 2545 Koala Dr
- 5403 Jo Pass
- 5359 Wild Oak Dr Unit 54
- 2617 Greencliff Dr
- 5403 Wild Oak Dr
- 2374 N Wild Blossom Ct
- 2462 Burcham Dr
- 5120 Wardcliff Dr
- 4793 Ottawa Dr
- 5420 Park Lake Rd
- 2248 Kenmore Dr
- 4789 Ardmore Ave
- 5435 Blue Haven Dr
- 2162 Kent St
- 5171 Sapphire Cir Unit 24
- 5155 Sapphire Cir Unit 28
- 5154 Sapphire Cir Unit 29
- 5175 Sapphire Cir
- 5158 Sapphire Cir Unit 30
- 2317 Sapphire Ln
- 5166 Sapphire Cir Unit 32
- 2315 Sapphire Ln Unit 21
- 5170 Sapphire Cir Unit 33
- 5174 Sapphire Cir Unit 34
- 2313 Sapphire Ln Unit 20
- 2311 Sapphire Ln Unit 19
- 2319 Sapphire Ln Unit 36
- 2316 Sapphire Ln Unit 7
- 2371 Sapphire Ln Unit 133
- 2321 Sapphire Ln Unit 37
- 2320 Sapphire Ln
- 2375 Sapphire Ln Unit 134
- 2312 Sapphire Ln Unit 6