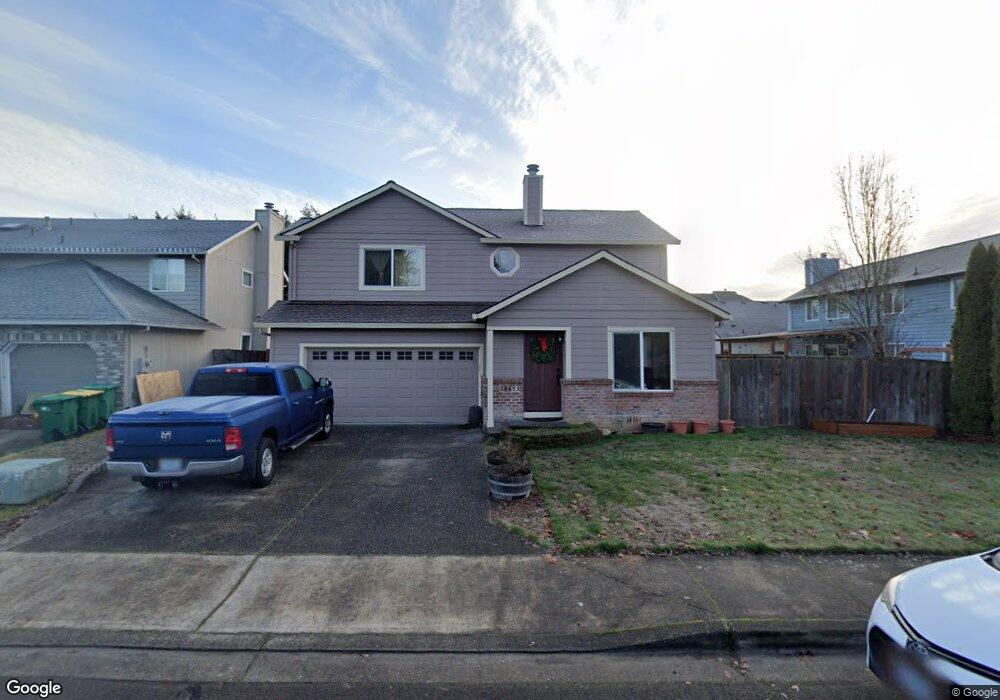
51635 SW 3rd St Scappoose, OR 97056
Estimated Value: $454,456 - $549,000
4
Beds
3
Baths
1,592
Sq Ft
$309/Sq Ft
Est. Value
About This Home
This home is located at 51635 SW 3rd St, Scappoose, OR 97056 and is currently estimated at $491,614, approximately $308 per square foot. 51635 SW 3rd St is a home located in Columbia County with nearby schools including Scappoose High School and Scappoose Adventist School.
Ownership History
Date
Name
Owned For
Owner Type
Purchase Details
Closed on
Jul 20, 2022
Sold by
Viera Jr David M
Bought by
David Viera Jr And Josephine Viera Trust
Current Estimated Value
Purchase Details
Closed on
May 4, 2022
Sold by
David Viera Jr And Josephine Viera Trust
Bought by
Viera David M and Viera Josephine D
Purchase Details
Closed on
Mar 22, 2018
Sold by
Viera David M and Viera Josephine D
Bought by
Viera David M and Viera Josephine D
Purchase Details
Closed on
Jun 5, 1997
Bought by
Viera David M and Viera Josephine D
Create a Home Valuation Report for This Property
The Home Valuation Report is an in-depth analysis detailing your home's value as well as a comparison with similar homes in the area
Home Values in the Area
Average Home Value in this Area
Purchase History
| Date | Buyer | Sale Price | Title Company |
|---|---|---|---|
| David Viera Jr And Josephine Viera Trust | -- | None Listed On Document | |
| Viera David M | $91,000 | -- | |
| Viera David M | -- | None Available | |
| Viera David M | $136,000 | -- |
Source: Public Records
Tax History Compared to Growth
Tax History
| Year | Tax Paid | Tax Assessment Tax Assessment Total Assessment is a certain percentage of the fair market value that is determined by local assessors to be the total taxable value of land and additions on the property. | Land | Improvement |
|---|---|---|---|---|
| 2025 | $3,931 | $238,750 | $85,030 | $153,720 |
| 2024 | $3,822 | $231,800 | $82,550 | $149,250 |
| 2023 | $3,786 | $225,050 | $84,430 | $140,620 |
| 2022 | $3,627 | $218,500 | $81,430 | $137,070 |
| 2021 | $3,523 | $212,140 | $86,290 | $125,850 |
| 2020 | $3,268 | $205,970 | $83,580 | $122,390 |
| 2019 | $3,182 | $199,980 | $80,402 | $119,578 |
| 2018 | $3,110 | $194,160 | $90,120 | $104,040 |
| 2017 | $3,054 | $188,510 | $87,490 | $101,020 |
| 2016 | $3,015 | $183,020 | $84,940 | $98,080 |
| 2015 | $2,863 | $177,690 | $69,620 | $108,070 |
| 2014 | $2,790 | $172,520 | $61,580 | $110,940 |
Source: Public Records
Map
Nearby Homes
- 33298 SW Meadowbrook Dr
- 33410 Meadowbrook Dr
- 33279 SW Havlik Dr
- 51925 Columbia River Hwy
- 51692 SE 3rd St
- 33370 SW Rokin Way
- 33358 SW Rokin Way
- 33344 SW Rokin Way
- 51350 SW Randstad St
- 33375 SW Rokin Way
- 33363 SW Rokin Way
- 51557 SW Em Watts Rd
- 51540 SE Westlake Dr Unit 56
- 51459 SE Westlake Dr Unit 102
- 32922 Coal Creek Rd
- 51096 SW Klompen St
- 51096 SW Klompen St Unit H138
- 33340 SW Rokin Way
- 51086 SW Klompen St
- 51082 SW Klompen St
- 51645 SW 3rd St
- 33361 SW Jenny Ln
- 51635 SW Snyder Ct
- 33382 SW Jenny Ln
- 51642 SW 3rd St
- 51645 SW Snyder Ct
- 33394 SW Jenny Ln
- 51621 SW 3rd St
- 33331 SW Jenny Ln
- 33334 SW Jenny Ln
- 33408 SW Jenny Ln Unit 1
- 33408 SW Jenny Ln
- 33320 SW Jenny Ln
- 33317 SW Jenny Ln
- 51646 SW Snyder Ct
- 51636 SW Snyder Ct
- 33305 Barta Ct
- 33306 SW Jenny Ln
- 33420 SW Jenny Ln
- 33311 Barta Ct