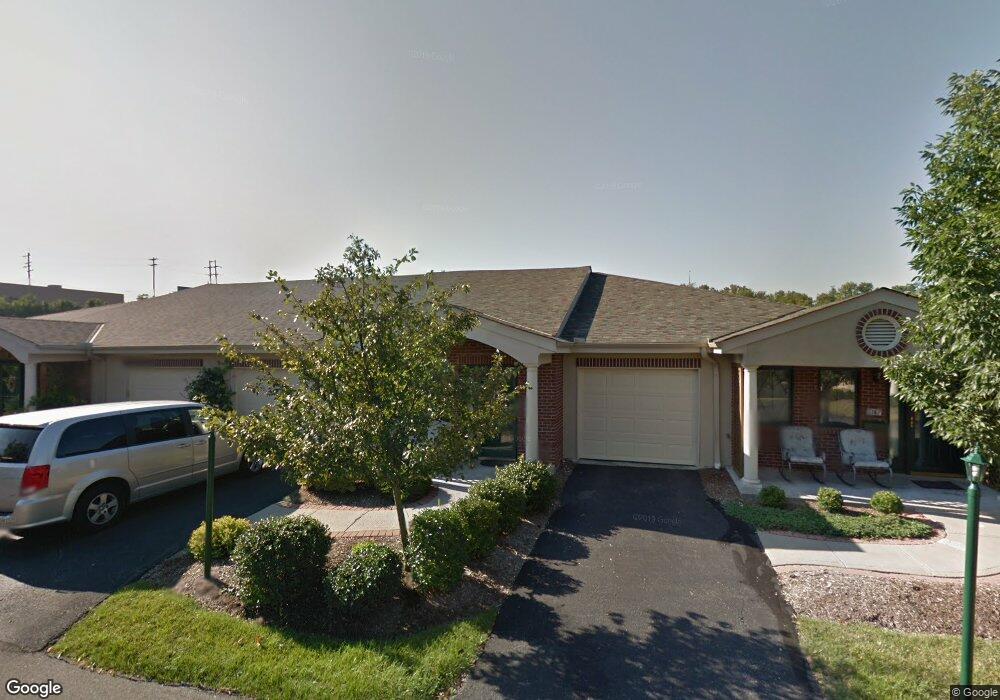
5165 Northbend Crossing Unit 103 Cincinnati, OH 45247
West Monfort Heights NeighborhoodEstimated Value: $204,002 - $218,000
2
Beds
2
Baths
1,263
Sq Ft
$168/Sq Ft
Est. Value
About This Home
This home is located at 5165 Northbend Crossing Unit 103, Cincinnati, OH 45247 and is currently estimated at $212,751, approximately $168 per square foot. 5165 Northbend Crossing Unit 103 is a home located in Hamilton County with nearby schools including Monfort Heights Elementary School, White Oak Middle School, and Colerain High School.
Ownership History
Date
Name
Owned For
Owner Type
Purchase Details
Closed on
Feb 21, 2003
Sold by
S/Nbl Associates
Bought by
Marcum Robert Wayne and Marcum Betty Jean
Current Estimated Value
Create a Home Valuation Report for This Property
The Home Valuation Report is an in-depth analysis detailing your home's value as well as a comparison with similar homes in the area
Home Values in the Area
Average Home Value in this Area
Purchase History
| Date | Buyer | Sale Price | Title Company |
|---|---|---|---|
| Marcum Robert Wayne | $132,300 | -- |
Source: Public Records
Tax History Compared to Growth
Tax History
| Year | Tax Paid | Tax Assessment Tax Assessment Total Assessment is a certain percentage of the fair market value that is determined by local assessors to be the total taxable value of land and additions on the property. | Land | Improvement |
|---|---|---|---|---|
| 2024 | $2,608 | $59,283 | $10,325 | $48,958 |
| 2023 | $2,663 | $59,283 | $10,325 | $48,958 |
| 2022 | $2,052 | $40,289 | $8,012 | $32,277 |
| 2021 | $1,871 | $40,289 | $8,012 | $32,277 |
| 2020 | $1,902 | $40,289 | $8,012 | $32,277 |
| 2019 | $1,875 | $36,964 | $7,350 | $29,614 |
| 2018 | $1,670 | $36,964 | $7,350 | $29,614 |
| 2017 | $1,571 | $36,964 | $7,350 | $29,614 |
| 2016 | $1,609 | $37,304 | $6,395 | $30,909 |
| 2015 | $1,631 | $37,304 | $6,395 | $30,909 |
| 2014 | $1,634 | $37,304 | $6,395 | $30,909 |
| 2013 | $1,827 | $42,875 | $7,350 | $35,525 |
Source: Public Records
Map
Nearby Homes
- 5440 Asbury Lake Dr
- 3775 Boomer Rd
- 5476 Audro Dr
- 4201 Boomer Rd
- 4491 W Fork Rd
- 3731 Ridgedale Dr
- 5538 Silverpoint Dr
- The McPherson Plan at Ivy Rose - Designer Collection
- Carrington Plan at Ivy Rose - Designer Collection
- Winston Plan at Ivy Rose - Designer Collection
- Calvin Plan at Ivy Rose - Designer Collection
- Miles Plan at Ivy Rose - Designer Collection
- Blair Plan at Ivy Rose - Designer Collection
- Magnolia Plan at Ivy Rose - Designer Collection
- Grandin Plan at Ivy Rose - Designer Collection
- Wyatt Plan at Ivy Rose - Designer Collection
- Avery Plan at Ivy Rose - Designer Collection
- Charles Plan at Ivy Rose - Designer Collection
- 4575 Boomer Rd
- 4628 Boomer Rd
- 5163 Northbend Crossing Unit 102
- 5153 Northbend Crossing Unit 106
- 5167 N Bend Crossing
- 5163 Northbend Crossing
- 5151 N Bend Crossing
- 5151 Northbend Crossing Unit 107
- 5155 Northbend Crossing Unit 105
- 5161 Northbend Crossing Unit 101
- 5161 N Bend Crossing
- 5167 Northbend Crossing Unit 104
- 5153 N Bend Crossing Unit 10-6
- 5155 N Bend Crossing
- 5171 N Bend Crossing Unit 11
- 5171 Northbend Crossing Unit 111
- 5145 Northbend Crossing Unit 115
- 5105 N Bend Crossing
- 5221 Northbend Crossing Unit 64
- 5223 Northbend Crossing
- 5231 Northbend Crossing
- 5231 N Bend Crossing