Estimated Value: $407,000 - $424,000
3
Beds
2
Baths
1,922
Sq Ft
$216/Sq Ft
Est. Value
About This Home
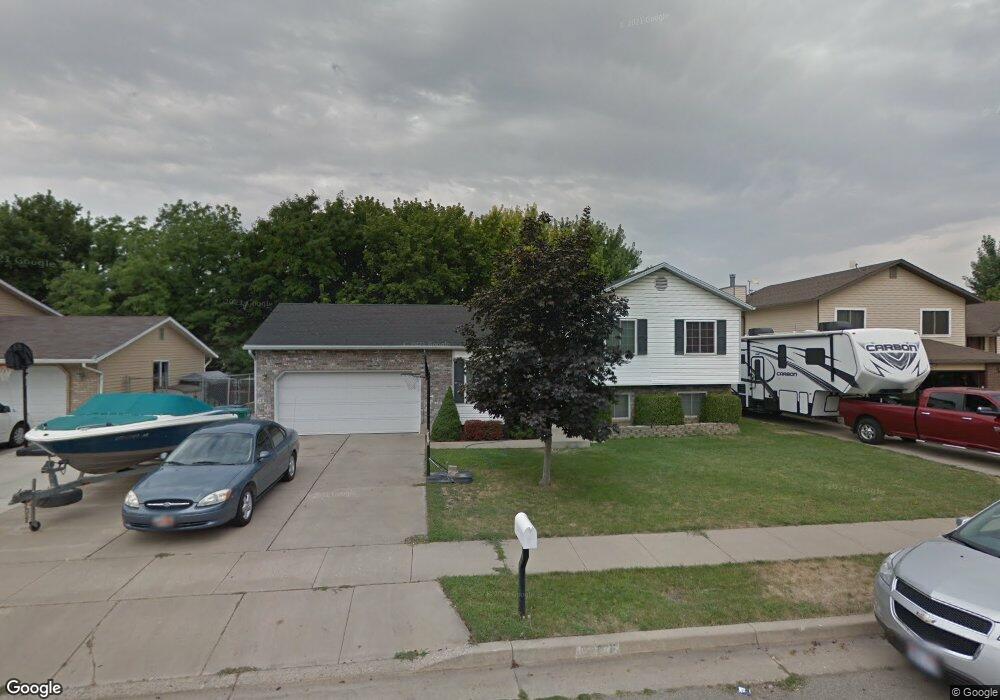
This home is located at 5165 S 2975 W, Roy, UT 84067 and is currently estimated at $414,935, approximately $215 per square foot. 5165 S 2975 W is a home located in Weber County with nearby schools including Midland School, Sand Ridge Junior High School, and Roy High School.
Ownership History
Date
Name
Owned For
Owner Type
Purchase Details
Closed on
May 2, 2011
Sold by
Liegl Jason A and Liegl Angela M
Bought by
Osborn Lyndi
Current Estimated Value
Home Financials for this Owner
Home Financials are based on the most recent Mortgage that was taken out on this home.
Original Mortgage
$151,070
Outstanding Balance
$104,258
Interest Rate
4.73%
Mortgage Type
FHA
Estimated Equity
$310,677
Purchase Details
Closed on
Feb 14, 2007
Sold by
Jensen Douglas S and Jensen Shannon M
Bought by
Leigl Jason A
Purchase Details
Closed on
May 1, 1998
Sold by
Jensen Paul M and Jensen Amy N
Bought by
Jensen Douglas S
Home Financials for this Owner
Home Financials are based on the most recent Mortgage that was taken out on this home.
Original Mortgage
$116,045
Interest Rate
7.06%
Mortgage Type
FHA
Create a Home Valuation Report for This Property
The Home Valuation Report is an in-depth analysis detailing your home's value as well as a comparison with similar homes in the area
Home Values in the Area
Average Home Value in this Area
Purchase History
| Date | Buyer | Sale Price | Title Company |
|---|---|---|---|
| Osborn Lyndi | -- | Metro National Title | |
| Leigl Jason A | -- | First American Title Riverda | |
| Jensen Douglas S | -- | First American Title |
Source: Public Records
Mortgage History
| Date | Status | Borrower | Loan Amount |
|---|---|---|---|
| Open | Osborn Lyndi | $151,070 | |
| Previous Owner | Jensen Douglas S | $116,045 |
Source: Public Records
Tax History Compared to Growth
Tax History
| Year | Tax Paid | Tax Assessment Tax Assessment Total Assessment is a certain percentage of the fair market value that is determined by local assessors to be the total taxable value of land and additions on the property. | Land | Improvement |
|---|---|---|---|---|
| 2025 | $2,445 | $384,557 | $130,015 | $254,542 |
| 2024 | $2,347 | $204,049 | $71,508 | $132,541 |
| 2023 | $2,267 | $197,450 | $65,864 | $131,586 |
| 2022 | $2,495 | $226,050 | $55,008 | $171,042 |
| 2021 | $1,974 | $292,000 | $75,002 | $216,998 |
| 2020 | $1,875 | $255,000 | $75,002 | $179,998 |
| 2019 | $1,771 | $226,000 | $44,989 | $181,011 |
| 2018 | $1,640 | $196,000 | $44,989 | $151,011 |
| 2017 | $1,502 | $167,000 | $44,989 | $122,011 |
| 2016 | $1,517 | $91,267 | $21,944 | $69,323 |
| 2015 | $1,349 | $82,316 | $21,944 | $60,372 |
| 2014 | $1,288 | $77,277 | $21,944 | $55,333 |
Source: Public Records
Map
Nearby Homes