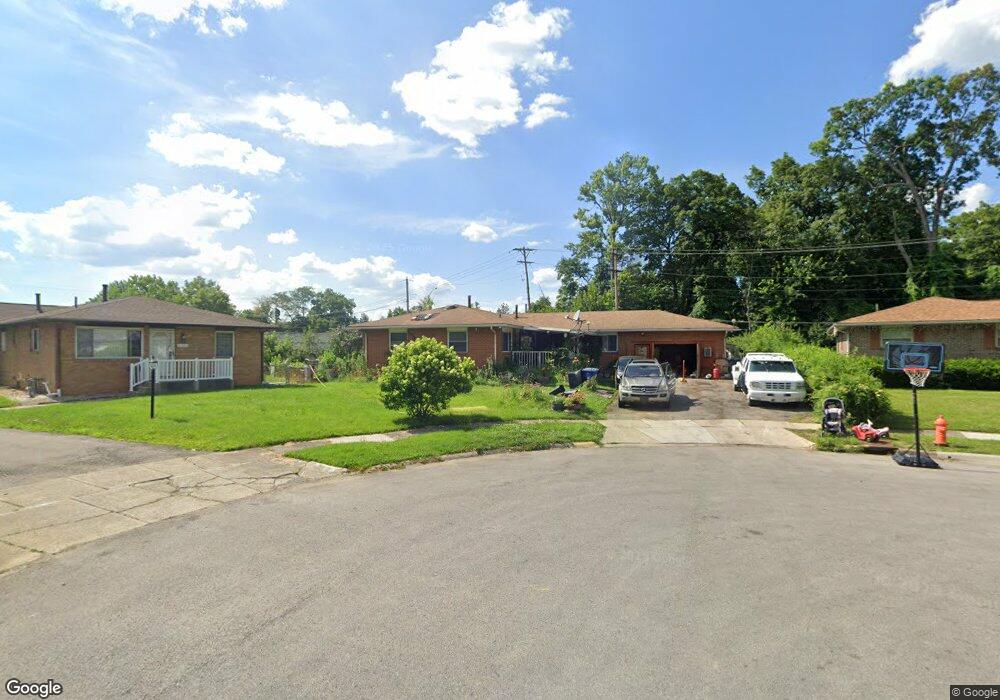
5165 Saling Ct Unit 167 Columbus, OH 43229
Woodward Park NeighborhoodEstimated Value: $325,000 - $384,000
5
Beds
3
Baths
2,556
Sq Ft
$138/Sq Ft
Est. Value
About This Home
This home is located at 5165 Saling Ct Unit 167, Columbus, OH 43229 and is currently estimated at $352,635, approximately $137 per square foot. 5165 Saling Ct Unit 167 is a home located in Franklin County with nearby schools including Valley Forge Elementary School, Woodward Park Middle School, and Northland High School.
Ownership History
Date
Name
Owned For
Owner Type
Purchase Details
Closed on
Feb 16, 2024
Sold by
Liads George L and Liadis Nikki G
Bought by
Liadis George L
Current Estimated Value
Purchase Details
Closed on
Jan 23, 2018
Sold by
Liads George and Liads George L
Bought by
Liadls Nikki G and Liadls George L
Purchase Details
Closed on
Apr 15, 2004
Sold by
Estate Of Limberis P Liadis
Bought by
Liadis Eugenia L
Purchase Details
Closed on
Mar 17, 2004
Sold by
Estate Of Limberis P Liadis
Bought by
Liadis Eugenia L
Purchase Details
Closed on
Apr 2, 1979
Bought by
Liadis Liamberis P
Create a Home Valuation Report for This Property
The Home Valuation Report is an in-depth analysis detailing your home's value as well as a comparison with similar homes in the area
Home Values in the Area
Average Home Value in this Area
Purchase History
| Date | Buyer | Sale Price | Title Company |
|---|---|---|---|
| Liadis George L | -- | None Listed On Document | |
| Liadls Nikki G | -- | None Available | |
| Liadis Eugenia L | -- | -- | |
| Liadis Eugenia L | -- | -- | |
| Liadis Liamberis P | -- | -- |
Source: Public Records
Tax History Compared to Growth
Tax History
| Year | Tax Paid | Tax Assessment Tax Assessment Total Assessment is a certain percentage of the fair market value that is determined by local assessors to be the total taxable value of land and additions on the property. | Land | Improvement |
|---|---|---|---|---|
| 2024 | $4,555 | $110,120 | $21,320 | $88,800 |
| 2023 | $4,525 | $110,120 | $21,320 | $88,800 |
| 2022 | $2,858 | $63,080 | $13,690 | $49,390 |
| 2021 | $2,863 | $63,080 | $13,690 | $49,390 |
| 2020 | $2,867 | $63,080 | $13,690 | $49,390 |
| 2019 | $2,570 | $50,480 | $10,960 | $39,520 |
| 2018 | $2,758 | $50,480 | $10,960 | $39,520 |
| 2017 | $2,544 | $50,480 | $10,960 | $39,520 |
| 2016 | $2,520 | $46,200 | $10,990 | $35,210 |
| 2015 | $2,292 | $46,200 | $10,990 | $35,210 |
| 2014 | $2,297 | $46,200 | $10,990 | $35,210 |
| 2013 | $1,268 | $50,680 | $11,550 | $39,130 |
Source: Public Records
Map
Nearby Homes
- 5246 Eisenhower Rd
- 5318 Eisenhower Rd
- 964 Strimple Ave
- 4983 Almont Dr
- 5415 Vinewood Ct
- 4904 Almont Dr
- 1385 Thurell Rd
- 1125 Upland Dr
- 5480 Rockwood Ct Unit R1
- 4840 Almont Dr
- 1116 Tulsa Dr
- 5471 Crawford Dr
- 1414 Alvina Dr
- 1485 Norma Rd
- 1493 Boxwood Dr
- 5579 Norcross Rd
- 4815 Bourke Rd
- 5475 Worthington Forest Place E Unit 5475
- 4923 Karl Rd Unit 4925
- 4791 Bourke Rd
- 5161 Saling Ct Unit 163
- 5166 Saling Ct Unit 168
- 5139 Kingshill Dr Unit 141
- 5162 Saling Ct Unit 164
- 5162-5164 Saling Ct
- 5135 Kingshill Dr Unit 137
- 5156 Saling Ct Unit 158
- 5131 Kingshill Dr Unit 133
- 5131-5133 Kingshill Dr
- 1140 Saling Dr Unit 142
- 1140-1142 Saling Dr Unit 142
- 5127 Kingshill Dr Unit 29
- 5167 Woodside Dr
- 5159 Woodside Dr
- 5179 Woodside Dr
- 5149 Woodside Dr
- 5134 Kingshill Dr
- 1137 Saling Dr
- 5130 Kingshill Dr
- 1160 Saling Dr