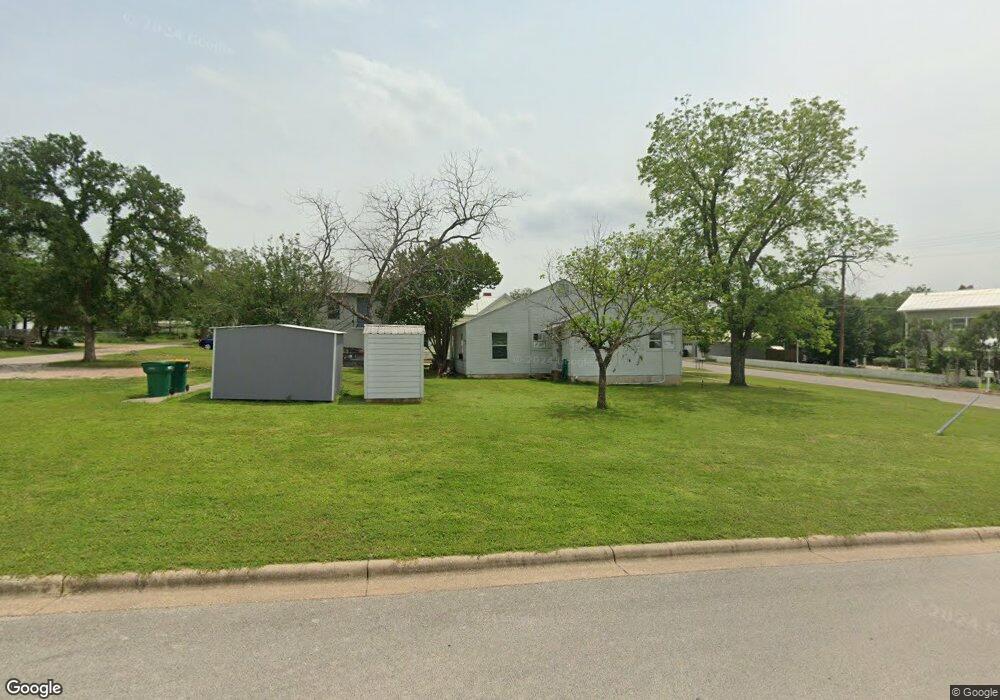
517 7th St Marble Falls, TX 78654
Estimated Value: $282,520 - $445,000
Studio
1
Bath
2,408
Sq Ft
$150/Sq Ft
Est. Value
About This Home
This home is located at 517 7th St, Marble Falls, TX 78654 and is currently estimated at $362,380, approximately $150 per square foot. 517 7th St is a home located in Burnet County with nearby schools including Marble Falls Elementary School, Marble Falls Middle School, and Marble Falls High School.
Ownership History
Date
Name
Owned For
Owner Type
Purchase Details
Closed on
Aug 26, 2008
Sold by
Aronson Carlene Elizabeth
Bought by
Everett Loretta Catherne
Current Estimated Value
Home Financials for this Owner
Home Financials are based on the most recent Mortgage that was taken out on this home.
Original Mortgage
$48,000
Outstanding Balance
$31,957
Interest Rate
6.54%
Mortgage Type
Purchase Money Mortgage
Estimated Equity
$330,423
Create a Home Valuation Report for This Property
The Home Valuation Report is an in-depth analysis detailing your home's value as well as a comparison with similar homes in the area
Home Values in the Area
Average Home Value in this Area
Purchase History
| Date | Buyer | Sale Price | Title Company |
|---|---|---|---|
| Everett Loretta Catherne | -- | None Avilebel |
Source: Public Records
Mortgage History
| Date | Status | Borrower | Loan Amount |
|---|---|---|---|
| Open | Everett Loretta Catherne | $48,000 |
Source: Public Records
Tax History
| Year | Tax Paid | Tax Assessment Tax Assessment Total Assessment is a certain percentage of the fair market value that is determined by local assessors to be the total taxable value of land and additions on the property. | Land | Improvement |
|---|---|---|---|---|
| 2025 | $2,885 | $285,471 | -- | -- |
| 2024 | $2,885 | $269,544 | -- | -- |
| 2023 | $2,885 | $255,065 | $0 | $0 |
| 2022 | $3,426 | $241,902 | -- | -- |
| 2021 | $4,666 | $216,909 | $35,658 | $181,251 |
| 2020 | $4,168 | $188,091 | $35,658 | $152,433 |
| 2019 | $4,112 | $188,091 | $35,658 | $152,433 |
| 2018 | $3,942 | $179,474 | $35,658 | $143,816 |
| 2017 | $3,657 | $156,674 | $35,658 | $121,016 |
| 2016 | $3,387 | $156,032 | $35,658 | $120,374 |
| 2015 | -- | $156,032 | $35,658 | $120,374 |
| 2014 | -- | $126,979 | $12,600 | $114,379 |
Source: Public Records
Map
Nearby Homes
Your Personal Tour Guide
Ask me questions while you tour the home.