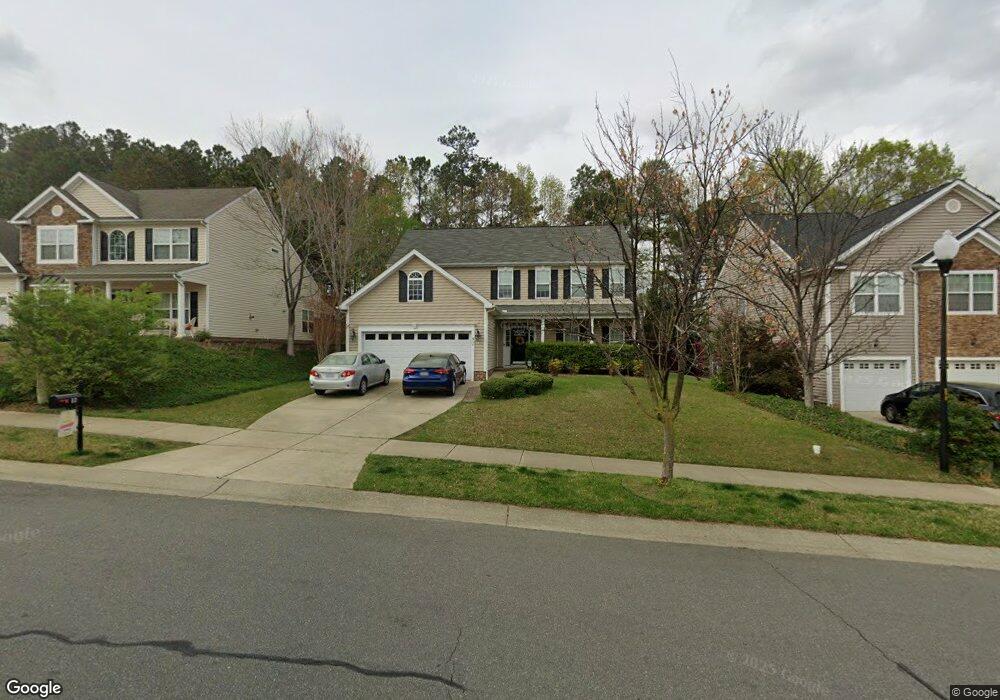
517 Anchor Creek Way Holly Springs, NC 27540
Estimated Value: $499,000 - $552,000
4
Beds
3
Baths
2,465
Sq Ft
$213/Sq Ft
Est. Value
About This Home
This home is located at 517 Anchor Creek Way, Holly Springs, NC 27540 and is currently estimated at $523,845, approximately $212 per square foot. 517 Anchor Creek Way is a home located in Wake County with nearby schools including Holly Springs Elementary School, Holly Ridge Middle School, and Apex Friendship High School.
Ownership History
Date
Name
Owned For
Owner Type
Purchase Details
Closed on
Feb 26, 2021
Sold by
Amdahl Brandon
Bought by
Judicious Llc and Anchor Creek Trust
Current Estimated Value
Purchase Details
Closed on
Oct 26, 2015
Sold by
Mercer Luke T and Mercer Jessica M
Bought by
Amdahl Brandon
Home Financials for this Owner
Home Financials are based on the most recent Mortgage that was taken out on this home.
Original Mortgage
$272,740
Interest Rate
3.93%
Mortgage Type
VA
Purchase Details
Closed on
Jan 4, 2008
Sold by
Anderson Homes Inc
Bought by
Mercer Luke T and Mercer Jessica M
Home Financials for this Owner
Home Financials are based on the most recent Mortgage that was taken out on this home.
Original Mortgage
$38,502
Interest Rate
5.77%
Mortgage Type
Unknown
Purchase Details
Closed on
Sep 9, 2007
Sold by
Bridgewaterland Resource Llc
Bought by
Anderson Homes Inc
Create a Home Valuation Report for This Property
The Home Valuation Report is an in-depth analysis detailing your home's value as well as a comparison with similar homes in the area
Home Values in the Area
Average Home Value in this Area
Purchase History
| Date | Buyer | Sale Price | Title Company |
|---|---|---|---|
| Judicious Llc | -- | None Available | |
| Amdahl Brandon | $267,000 | Attorney | |
| Mercer Luke T | $257,000 | None Available | |
| Anderson Homes Inc | $685,500 | None Available |
Source: Public Records
Mortgage History
| Date | Status | Borrower | Loan Amount |
|---|---|---|---|
| Previous Owner | Amdahl Brandon | $272,740 | |
| Previous Owner | Mercer Luke T | $38,502 | |
| Previous Owner | Mercer Luke T | $205,344 |
Source: Public Records
Tax History Compared to Growth
Tax History
| Year | Tax Paid | Tax Assessment Tax Assessment Total Assessment is a certain percentage of the fair market value that is determined by local assessors to be the total taxable value of land and additions on the property. | Land | Improvement |
|---|---|---|---|---|
| 2025 | $4,380 | $506,611 | $120,000 | $386,611 |
| 2024 | $4,362 | $506,611 | $120,000 | $386,611 |
| 2023 | $3,457 | $318,686 | $55,000 | $263,686 |
| 2022 | $3,338 | $318,686 | $55,000 | $263,686 |
| 2021 | $3,276 | $318,686 | $55,000 | $263,686 |
| 2020 | $3,276 | $318,686 | $55,000 | $263,686 |
| 2019 | $3,017 | $249,090 | $50,000 | $199,090 |
| 2018 | $2,727 | $249,090 | $50,000 | $199,090 |
| 2017 | $2,629 | $249,090 | $50,000 | $199,090 |
| 2016 | $2,593 | $249,090 | $50,000 | $199,090 |
| 2015 | $2,562 | $242,212 | $42,000 | $200,212 |
| 2014 | $2,474 | $242,212 | $42,000 | $200,212 |
Source: Public Records
Map
Nearby Homes
- 116 Cobblebrook Ct
- 204 Leafgate Ct
- 201 Holmby Ct
- 213 Capello Ct
- 425 Arbor Creek Dr
- 112 Fairford Dr
- 208 Apple Drupe Way
- 5620 Lockley Rd
- 300 Firefly Rd
- 148 Danesway Dr
- 138 Cobalt Creek Way
- 1539 N Main St
- 317 Commons Dr
- 225 Hazelmere Dr
- 112 Sanchez Ct
- 109 Willow View Ln
- 5325 Dutch Elm Dr
- 127 Willow View Ln
- 201 Mayfield Dr
- 204 Chrismill Ln
- 601 Anchor Creek Way
- 513 Anchor Creek Way
- 605 Anchor Creek Way
- 122 Aldeburgh Ct
- 118 Aldeburgh Ct
- 512 Anchor Creek Way
- 126 Aldeburgh Ct
- 114 Aldeburgh Ct
- 508 Anchor Creek Way
- 101 Boatdock Dr
- 609 Anchor Creek Way
- 505 Anchor Creek Way
- 504 Anchor Creek Way
- 112 Aldeburgh Ct
- 105 Boatdock Dr
- 613 Anchor Creek Way
- 720 Wellspring Dr
- 100 Boatdock Dr
- 417 Gooseberry Dr
- 425 Gooseberry Dr