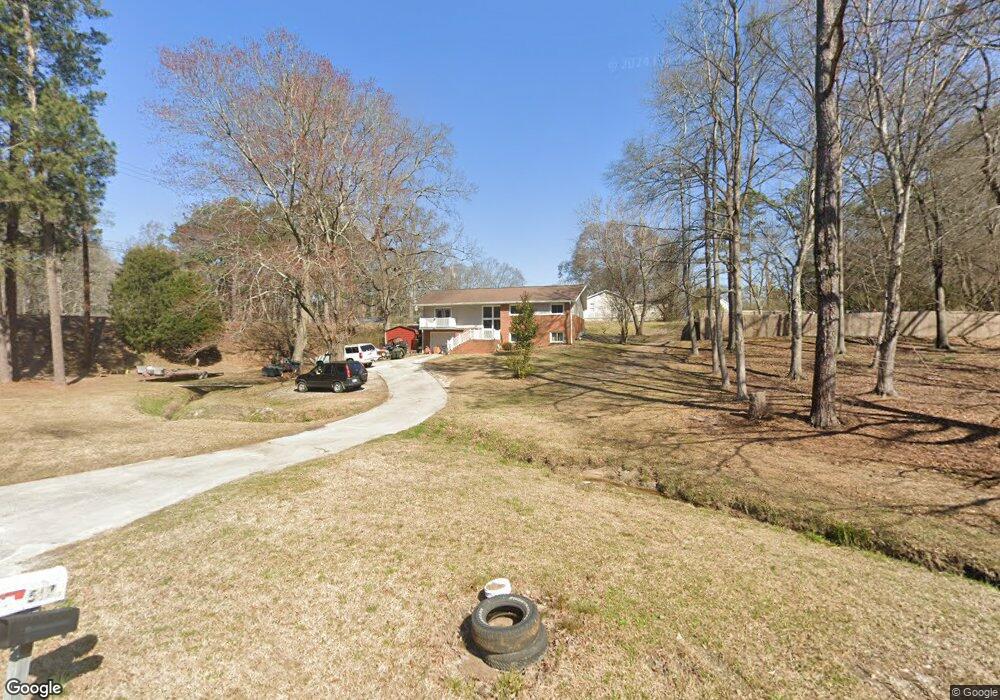
517 Bolijeri Blvd Villa Rica, GA 30180
Estimated Value: $244,000 - $301,000
3
Beds
2
Baths
1,397
Sq Ft
$194/Sq Ft
Est. Value
About This Home
This home is located at 517 Bolijeri Blvd, Villa Rica, GA 30180 and is currently estimated at $270,903, approximately $193 per square foot. 517 Bolijeri Blvd is a home located in Carroll County with nearby schools including Glanton-Hindsman Elementary School, Villa Rica Middle School, and Villa Rica High School.
Ownership History
Date
Name
Owned For
Owner Type
Purchase Details
Closed on
Jul 12, 2021
Sold by
T & S Holdings Llc
Bought by
Murray Melissa Ann
Current Estimated Value
Home Financials for this Owner
Home Financials are based on the most recent Mortgage that was taken out on this home.
Original Mortgage
$174,600
Outstanding Balance
$158,567
Interest Rate
2.96%
Mortgage Type
New Conventional
Estimated Equity
$112,336
Purchase Details
Closed on
Sep 16, 2020
Sold by
Pulver Stephan J
Bought by
T & S Holdings Llc
Purchase Details
Closed on
Jun 4, 2012
Sold by
Carter Bobbie J
Bought by
Pulver Stephen J and Pulver Theresa K
Purchase Details
Closed on
May 29, 2012
Sold by
Baskin John R
Bought by
Pulver Stephen J and Pulver Theresa K
Purchase Details
Closed on
May 25, 2012
Sold by
Baskin Carl G
Bought by
Pulver Stephen J and Pulver Theresa K
Purchase Details
Closed on
Jan 24, 1983
Bought by
Bskin Robert and Bskin Ruth
Create a Home Valuation Report for This Property
The Home Valuation Report is an in-depth analysis detailing your home's value as well as a comparison with similar homes in the area
Home Values in the Area
Average Home Value in this Area
Purchase History
| Date | Buyer | Sale Price | Title Company |
|---|---|---|---|
| Murray Melissa Ann | $180,000 | -- | |
| T & S Holdings Llc | -- | -- | |
| Pulver Stephen J | $30,000 | -- | |
| Pulver Stephen J | $30,000 | -- | |
| Pulver Stephen J | $30,000 | -- | |
| Pulver Stephen J | $30,000 | -- | |
| Pulver Stephen J | $30,000 | -- | |
| Pulver Stephen J | $30,000 | -- | |
| Bskin Robert | -- | -- |
Source: Public Records
Mortgage History
| Date | Status | Borrower | Loan Amount |
|---|---|---|---|
| Open | Murray Melissa Ann | $174,600 |
Source: Public Records
Tax History Compared to Growth
Tax History
| Year | Tax Paid | Tax Assessment Tax Assessment Total Assessment is a certain percentage of the fair market value that is determined by local assessors to be the total taxable value of land and additions on the property. | Land | Improvement |
|---|---|---|---|---|
| 2024 | $3,165 | $112,184 | $18,961 | $93,223 |
| 2023 | $3,165 | $104,015 | $18,962 | $85,053 |
| 2022 | $2,256 | $80,912 | $12,641 | $68,271 |
| 2021 | $1,541 | $48,336 | $7,710 | $40,626 |
| 2020 | $1,543 | $48,336 | $7,710 | $40,626 |
| 2019 | $1,856 | $58,706 | $9,364 | $49,342 |
| 2018 | $1,356 | $41,972 | $7,800 | $34,172 |
| 2017 | $1,373 | $41,972 | $7,800 | $34,172 |
| 2016 | $1,338 | $47,929 | $11,016 | $36,913 |
| 2015 | $893 | $25,917 | $7,200 | $18,717 |
| 2014 | $802 | $23,110 | $7,200 | $15,910 |
Source: Public Records
Map
Nearby Homes
- 413 Dallas Hwy
- 506 Northside Place
- 224 Crest Creek Way
- 212 Rockmart Rd
- 318 N Dogwood St
- 915 Sundown Point
- 913 Sundown Point
- 511 Reid St
- 208 N North Dogwood St
- 208 N Dogwood St
- 0 White St
- 515 Vandenburg Dr
- 518 Vandenburg Dr
- 113 W Gordon St
- 626 Rockmart Rd
- 0 Church Ln Unit 10633475
- 0 Church Ln Unit 7673213
- 0 Church Ln Unit 155
- 0 Mccurdy Rd Unit 10415773
- 1395 Georgia 61
- 505 Bolijeri Blvd
- 419 Dallas Hwy
- 408 Northside Dr
- 400 Dallas Hwy
- 503 Bolijeri Blvd
- 410 Northside Dr
- 327 Dallas Hwy
- 508 Bolijeri Blvd
- 423 Dallas Hwy
- 414 Northside Dr
- 421 Bolijeri Blvd
- 500 Dallas Hwy
- 335 Walker St
- 329 Walker St
- 401 Walker St
- 418 Bolijeri Blvd Unit A
- 418 Bolijeri Blvd
- 418 Bolijeri Blvd Unit 2
- 321 Dallas Hwy
- 43 Cross Creek Ct Unit 13