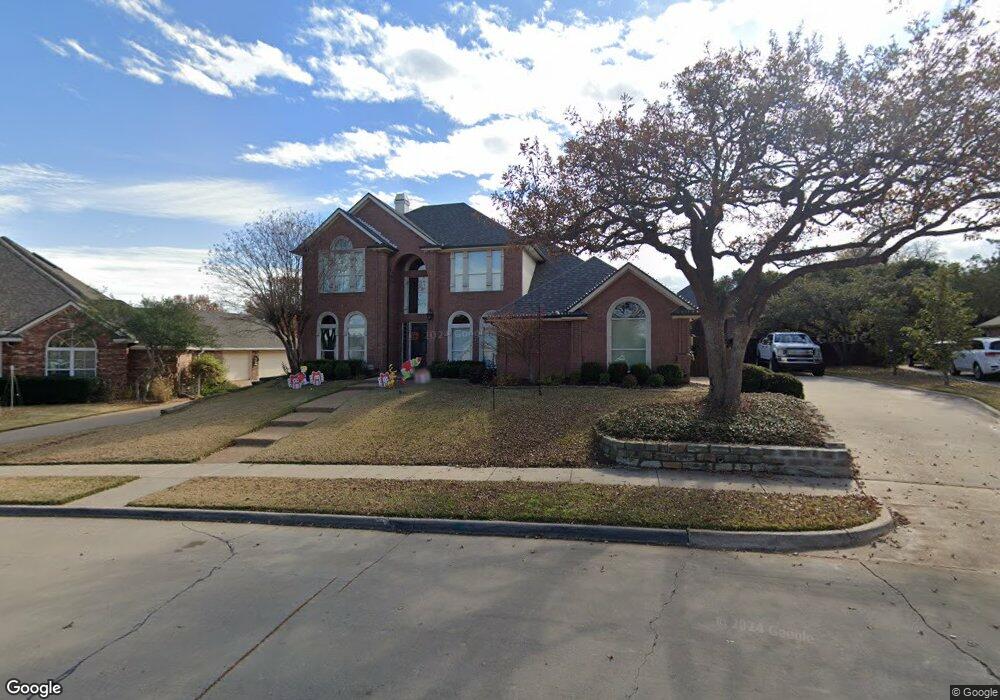
517 Bridlewood S Colleyville, TX 76034
Estimated Value: $759,000 - $778,562
3
Beds
3
Baths
3,155
Sq Ft
$244/Sq Ft
Est. Value
About This Home
This home is located at 517 Bridlewood S, Colleyville, TX 76034 and is currently estimated at $768,391, approximately $243 per square foot. 517 Bridlewood S is a home located in Tarrant County with nearby schools including Bransford Elementary School, Colleyville Middle School, and Grapevine High School.
Ownership History
Date
Name
Owned For
Owner Type
Purchase Details
Closed on
Sep 9, 2021
Sold by
Hooton Donald Milton and Hooton Chelsey
Bought by
Hooton Donald Milton and Hooton Chelsey
Current Estimated Value
Purchase Details
Closed on
Jun 29, 2012
Sold by
Weakley Cindy D and Weakley Jerry
Bought by
Hooton Donald Milton
Home Financials for this Owner
Home Financials are based on the most recent Mortgage that was taken out on this home.
Original Mortgage
$290,000
Outstanding Balance
$201,505
Interest Rate
3.81%
Mortgage Type
New Conventional
Estimated Equity
$566,886
Purchase Details
Closed on
Aug 4, 1995
Sold by
P & S Construction Company
Bought by
Weakley Cindy D
Home Financials for this Owner
Home Financials are based on the most recent Mortgage that was taken out on this home.
Original Mortgage
$189,600
Interest Rate
7.59%
Create a Home Valuation Report for This Property
The Home Valuation Report is an in-depth analysis detailing your home's value as well as a comparison with similar homes in the area
Home Values in the Area
Average Home Value in this Area
Purchase History
| Date | Buyer | Sale Price | Title Company |
|---|---|---|---|
| Hooton Donald Milton | -- | None Available | |
| Hooton Donald Milton | -- | Alamo Title Company | |
| Weakley Cindy D | -- | American Title Company |
Source: Public Records
Mortgage History
| Date | Status | Borrower | Loan Amount |
|---|---|---|---|
| Open | Hooton Donald Milton | $290,000 | |
| Previous Owner | Weakley Cindy D | $189,600 |
Source: Public Records
Tax History Compared to Growth
Tax History
| Year | Tax Paid | Tax Assessment Tax Assessment Total Assessment is a certain percentage of the fair market value that is determined by local assessors to be the total taxable value of land and additions on the property. | Land | Improvement |
|---|---|---|---|---|
| 2025 | $8,830 | $697,602 | $156,100 | $541,502 |
| 2024 | $8,830 | $704,649 | $156,100 | $548,549 |
| 2023 | $9,992 | $620,000 | $156,100 | $463,900 |
| 2022 | $10,635 | $542,385 | $156,100 | $386,285 |
| 2021 | $10,750 | $489,532 | $100,000 | $389,532 |
| 2020 | $10,014 | $450,668 | $100,000 | $350,668 |
| 2019 | $10,589 | $458,000 | $100,000 | $358,000 |
| 2018 | $2,540 | $427,201 | $90,000 | $337,201 |
| 2017 | $9,640 | $408,036 | $90,000 | $318,036 |
| 2016 | $9,046 | $390,000 | $87,827 | $302,173 |
| 2015 | $7,869 | $348,100 | $45,000 | $303,100 |
| 2014 | $7,869 | $348,100 | $45,000 | $303,100 |
Source: Public Records
Map
Nearby Homes
- 628 Huntwich Dr
- 4105 Inwood Ln
- 909 Brestol Ct W
- 405 Woodbriar Ct
- 4600 Bransford Rd
- 3605 Spring Valley Dr
- 3624 Wayne Ct
- 3609 Wayne Ct
- 4002 Copperwood Ct
- 3907 Copperwood Ct
- 4600 Westbury Dr
- 1109 Simpson Terrace
- 4516 Dartmoore Ln
- 305 Warbler Dr
- 1136 Wingate Dr
- 3713 Brentwood Ct
- 1303 Crest Dr
- 312 Bremen Dr
- 2732 Woodbridge Dr
- 1104 Garry Lynne Dr
- 601 Bridlewood S
- 513 Bridlewood S
- 509 Bridlewood S
- 602 Bridlewood S
- 4101 Coachman Ln
- 505 Bridlewood S
- 4103 Coachman Ln
- 609 Bridlewood S
- 606 Bridlewood S
- 4100 Coachman Ln
- 501 Bridlewood S
- 4105 Coachman Ln
- 613 Bridlewood S
- 4102 Coachman Ln
- 4102 Bridlewood Ct
- 4100 Bridlewood Ct
- 4107 Coachman Ln
- 417 Bridlewood S
- 4104 Coachman Ln
- 4101 Paddington Ln