B
Landlord's Agent in 2012
Brent Atwood
*A-INACTIVE

Estimated Value: $244,000 - $298,000
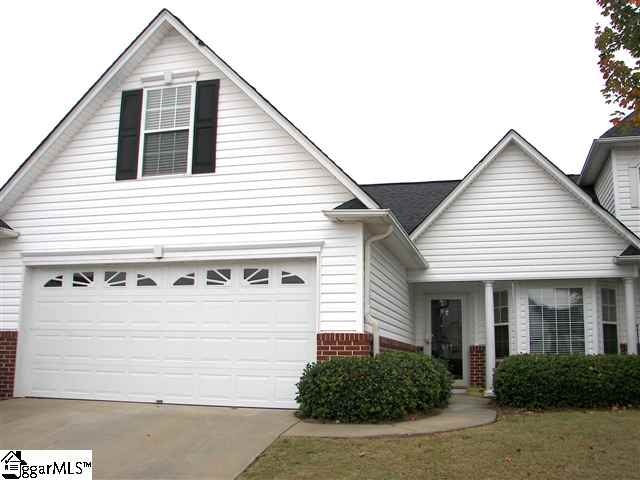
Great townhouse in gated community convienent to I85 and shopping. Open eat in kitchen. Den with gas fireplace. Large master bedroom with private bath. High bonus room over garage. Private patio. 2-car garage. NON-Smoking Home. NO PETS
Last Agent to Rent the Property
Brent Atwood
*A-INACTIVE Listed on: 08/08/2012
Last Renter's Agent
Brent Atwood
NAI Earle Furman, LLC License #53314
| Date | Buyer | Sale Price | Title Company |
|---|---|---|---|
| Buryk Allison J | $142,000 | -- | |
| Pryor Melissa H | $136,000 | None Available | |
| Black Cynthia P | $125,000 | -- | |
| Dyal James A | $120,000 | -- | |
| League James C | $117,525 | -- |
| Date | Status | Borrower | Loan Amount |
|---|---|---|---|
| Open | Buryk Allison J | $113,600 |
| Date | Event | Price | List to Sale | Price per Sq Ft |
|---|---|---|---|---|
| 12/01/2012 12/01/12 | Rented | $1,250 | 0.0% | -- |
| 11/09/2012 11/09/12 | Under Contract | -- | -- | -- |
| 08/08/2012 08/08/12 | For Rent | $1,250 | -- | -- |
| Year | Tax Paid | Tax Assessment Tax Assessment Total Assessment is a certain percentage of the fair market value that is determined by local assessors to be the total taxable value of land and additions on the property. | Land | Improvement |
|---|---|---|---|---|
| 2025 | $1,047 | $7,220 | $1,710 | $5,510 |
| 2024 | $1,047 | $6,280 | $1,010 | $5,270 |
| 2023 | $1,010 | $6,280 | $1,010 | $5,270 |
| 2022 | $934 | $6,280 | $1,010 | $5,270 |
| 2021 | $934 | $6,280 | $1,010 | $5,270 |
| 2020 | $872 | $5,460 | $880 | $4,580 |
| 2019 | $855 | $5,460 | $880 | $4,580 |
| 2018 | $930 | $5,460 | $880 | $4,580 |
| 2017 | $922 | $5,460 | $880 | $4,580 |
| 2016 | $873 | $136,550 | $22,000 | $114,550 |
| 2015 | $862 | $136,550 | $22,000 | $114,550 |
| 2014 | $910 | $145,500 | $23,000 | $122,500 |
B
Landlord's Agent in 2012
Brent Atwood
*A-INACTIVE
Source: Greater Greenville Association of REALTORS®
MLS Number: 1245470
APN: 0534.32-01-025.00
Disclaimer: Certain information contained herein is derived from information provided by parties other than Homes.com. All information provided is deemed reliable, but is not guaranteed to be accurate and should be independently verified.
![]() IDX information is provided exclusively for personal, non-commercial use, and may not be used for any purpose other than to identify prospective properties consumers may be interested in purchasing. Information is deemed reliable but not guaranteed.
IDX information is provided exclusively for personal, non-commercial use, and may not be used for any purpose other than to identify prospective properties consumers may be interested in purchasing. Information is deemed reliable but not guaranteed.
Ask me questions while you tour the home.