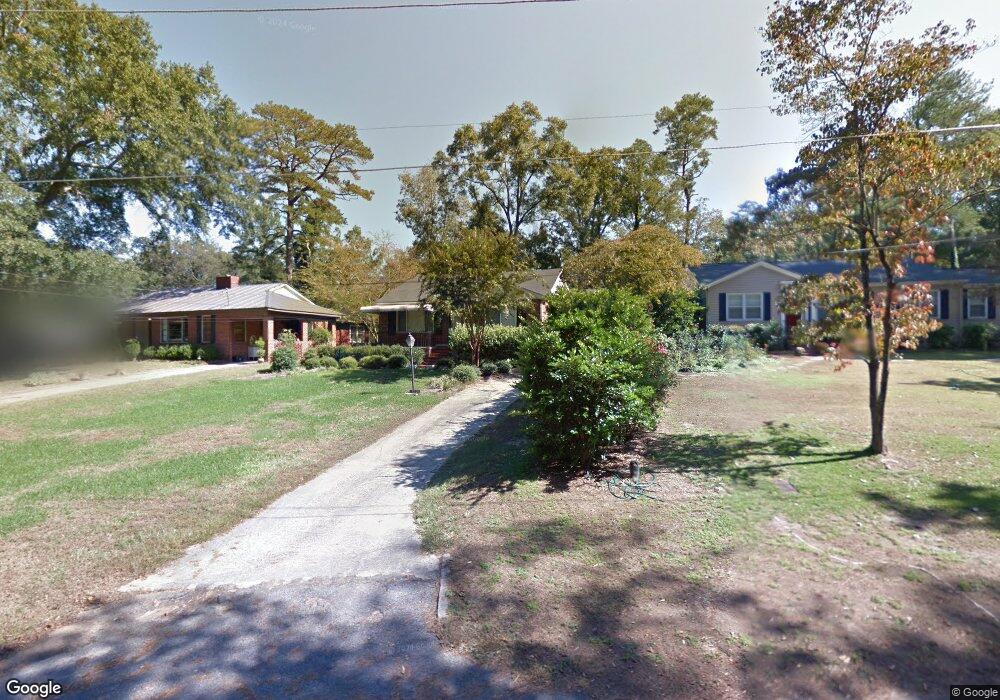
517 Corbin Terrace Unit 2 Macon, GA 31204
Estimated Value: $179,000 - $229,000
3
Beds
2
Baths
1,567
Sq Ft
$126/Sq Ft
Est. Value
About This Home
This home is located at 517 Corbin Terrace Unit 2, Macon, GA 31204 and is currently estimated at $197,893, approximately $126 per square foot. 517 Corbin Terrace Unit 2 is a home located in Bibb County with nearby schools including Rosa Taylor Elementary School, Miller Fine Arts Magnet Middle School, and Central High School.
Ownership History
Date
Name
Owned For
Owner Type
Purchase Details
Closed on
Apr 30, 2020
Sold by
Darnell Robert Tyler
Bought by
Medford Gabroel Mark
Current Estimated Value
Home Financials for this Owner
Home Financials are based on the most recent Mortgage that was taken out on this home.
Original Mortgage
$98,000
Outstanding Balance
$68,022
Interest Rate
3.6%
Mortgage Type
New Conventional
Estimated Equity
$129,871
Purchase Details
Closed on
Mar 13, 2010
Sold by
Nelson Gina M Cook
Bought by
Darnell Robert Tyler
Home Financials for this Owner
Home Financials are based on the most recent Mortgage that was taken out on this home.
Original Mortgage
$125,152
Interest Rate
5.5%
Mortgage Type
FHA
Purchase Details
Closed on
Sep 6, 2002
Bought by
Cook Gina M
Create a Home Valuation Report for This Property
The Home Valuation Report is an in-depth analysis detailing your home's value as well as a comparison with similar homes in the area
Home Values in the Area
Average Home Value in this Area
Purchase History
| Date | Buyer | Sale Price | Title Company |
|---|---|---|---|
| Medford Gabroel Mark | $122,500 | None Available | |
| Darnell Robert Tyler | $128,000 | None Available | |
| Cook Gina M | $116,000 | -- |
Source: Public Records
Mortgage History
| Date | Status | Borrower | Loan Amount |
|---|---|---|---|
| Open | Medford Gabroel Mark | $98,000 | |
| Previous Owner | Darnell Robert Tyler | $125,152 |
Source: Public Records
Tax History Compared to Growth
Tax History
| Year | Tax Paid | Tax Assessment Tax Assessment Total Assessment is a certain percentage of the fair market value that is determined by local assessors to be the total taxable value of land and additions on the property. | Land | Improvement |
|---|---|---|---|---|
| 2025 | $1,493 | $60,772 | $5,000 | $55,772 |
| 2024 | $1,543 | $60,772 | $5,000 | $55,772 |
| 2023 | $1,309 | $51,541 | $4,000 | $47,541 |
| 2022 | $2,073 | $59,886 | $6,196 | $53,690 |
| 2021 | $1,821 | $47,933 | $4,548 | $43,385 |
| 2020 | $1,854 | $47,762 | $4,548 | $43,214 |
| 2019 | $1,217 | $31,096 | $4,309 | $26,787 |
| 2018 | $2,044 | $31,096 | $4,309 | $26,787 |
| 2017 | $907 | $31,209 | $4,309 | $26,900 |
| 2016 | $838 | $31,208 | $4,309 | $26,900 |
| 2015 | $1,314 | $33,830 | $4,788 | $29,043 |
| 2014 | $1,710 | $36,452 | $5,266 | $31,186 |
Source: Public Records
Map
Nearby Homes
- 517 Corbin Terrace
- 525 Corbin Terrace
- 511 Corbin Terrace
- 537 Corbin Ave
- 0 Corbin Terrace
- 547 Corbin Ave
- 2369 Kingsley Dr
- 2391 Kingsley Dr
- 2365 Kingsley Dr
- 532 Rogers Dr
- 561 Corbin Ave
- 540 Rogers Dr
- 514 Corbin Ave
- 522 Corbin Ave
- 516 Corbin Ave
- 534 Corbin Ave
- 524 Rogers Dr
- 516 Rogers Dr
- 2411 Kingsley Dr
- 548 Rogers Dr