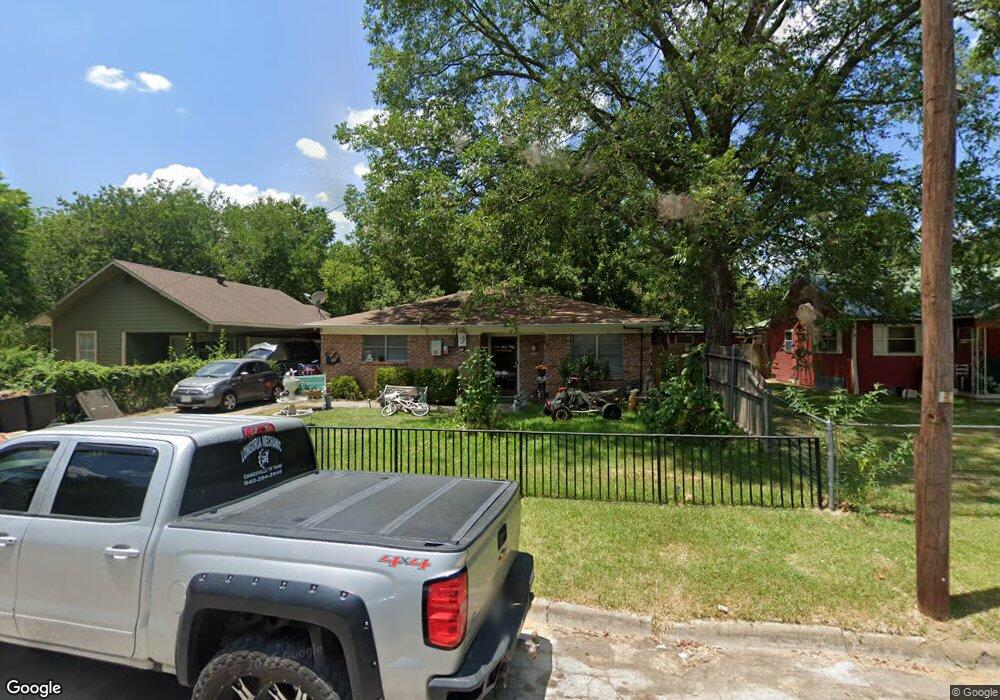
517 Cunningham St Gainesville, TX 76240
Estimated Value: $211,000 - $218,000
3
Beds
2
Baths
1,570
Sq Ft
$137/Sq Ft
Est. Value
About This Home
This home is located at 517 Cunningham St, Gainesville, TX 76240 and is currently estimated at $214,342, approximately $136 per square foot. 517 Cunningham St is a home located in Cooke County with nearby schools including Edison Elementary School, W.E. Chalmers Elementary School, and Gainesville Intermediate School.
Ownership History
Date
Name
Owned For
Owner Type
Purchase Details
Closed on
Dec 12, 2007
Sold by
Theobald Jerry L and Theobald Shirlene M
Bought by
Longoria Marco
Current Estimated Value
Home Financials for this Owner
Home Financials are based on the most recent Mortgage that was taken out on this home.
Original Mortgage
$63,000
Outstanding Balance
$39,452
Interest Rate
6.27%
Mortgage Type
New Conventional
Estimated Equity
$174,890
Create a Home Valuation Report for This Property
The Home Valuation Report is an in-depth analysis detailing your home's value as well as a comparison with similar homes in the area
Purchase History
| Date | Buyer | Sale Price | Title Company |
|---|---|---|---|
| Longoria Marco | -- | -- |
Source: Public Records
Mortgage History
| Date | Status | Borrower | Loan Amount |
|---|---|---|---|
| Open | Longoria Marco | $63,000 |
Source: Public Records
Tax History
| Year | Tax Paid | Tax Assessment Tax Assessment Total Assessment is a certain percentage of the fair market value that is determined by local assessors to be the total taxable value of land and additions on the property. | Land | Improvement |
|---|---|---|---|---|
| 2025 | $2,137 | $172,182 | $28,490 | $163,388 |
| 2024 | $2,137 | $189,531 | $28,490 | $161,041 |
| 2023 | $2,517 | $128,280 | $25,900 | $155,885 |
| 2022 | $2,539 | $156,581 | $23,100 | $133,481 |
| 2021 | $2,730 | $117,147 | $15,400 | $101,747 |
| 2020 | $2,560 | $108,617 | $14,700 | $93,917 |
| 2019 | $2,394 | $94,508 | $14,700 | $79,808 |
| 2018 | $2,174 | $79,651 | $7,350 | $72,301 |
| 2017 | $2,071 | $76,184 | $7,350 | $68,834 |
| 2015 | $1,663 | $70,025 | $7,350 | $62,675 |
| 2014 | $1,663 | $69,708 | $7,350 | $62,358 |
Source: Public Records
Map
Nearby Homes
- 608 Ritchey St
- 316 Ritchey St
- 1201 Fm
- 343 N Morris St
- 705 Fair Ave
- 805 Ritchey St
- 811 Ritchey St
- 315 N Morris St
- 815 Ritchey St
- 1007 E Broadway St
- 213 S Clements St
- 912 Ritchey St
- 901 N Morris St
- 418 Hillside Dr
- 802 Myrtle St
- 1601 Cherry St
- 1010 E Main St
- 603 N Schopmeyer St
- 605 N Schopmeyer St
- 1016 N Howeth St