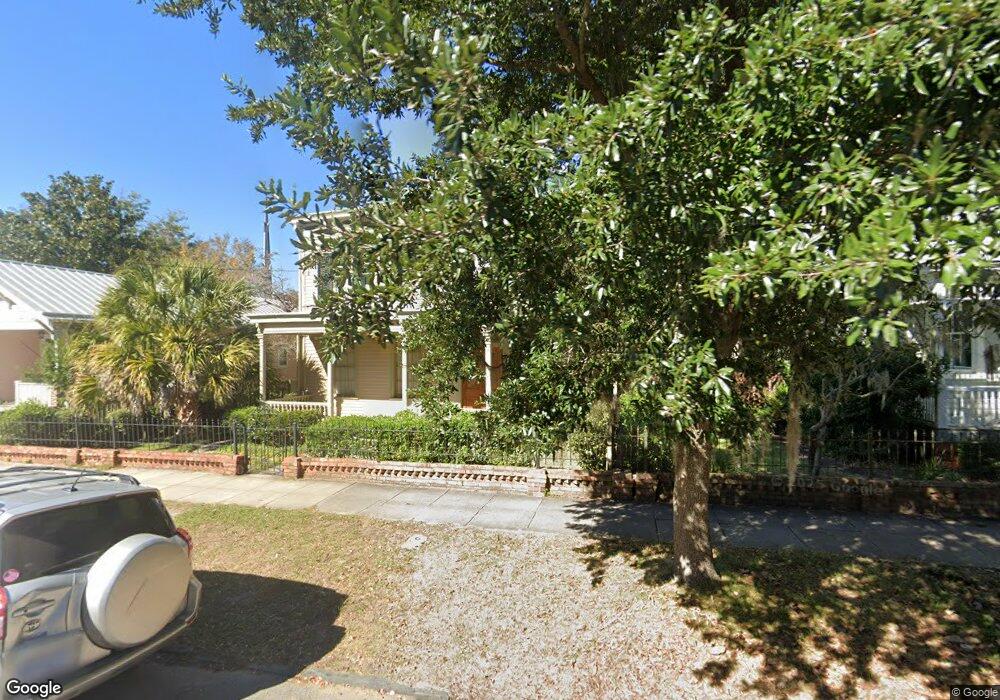
517 Dock St Wilmington, NC 28401
Old Wilmington NeighborhoodEstimated Value: $664,000 - $927,000
4
Beds
3
Baths
3,348
Sq Ft
$237/Sq Ft
Est. Value
About This Home
This home is located at 517 Dock St, Wilmington, NC 28401 and is currently estimated at $793,851, approximately $237 per square foot. 517 Dock St is a home located in New Hanover County with nearby schools including Snipes Academy of Arts & Design, Williston Middle School, and New Hanover High School.
Ownership History
Date
Name
Owned For
Owner Type
Purchase Details
Closed on
Aug 31, 1992
Sold by
Hollingsworth Robert Elsie
Bought by
Smith Everard Hall
Current Estimated Value
Purchase Details
Closed on
Apr 10, 1989
Sold by
Ericksen Michael Deborah
Bought by
Hollingsworth Robert Elsie
Purchase Details
Closed on
May 1, 1986
Sold by
Highsmith J Howard Betsy A
Bought by
Ericksen Michael Deborah
Purchase Details
Closed on
Jan 1, 1979
Bought by
Highsmith J Howard Betsy A
Create a Home Valuation Report for This Property
The Home Valuation Report is an in-depth analysis detailing your home's value as well as a comparison with similar homes in the area
Home Values in the Area
Average Home Value in this Area
Purchase History
| Date | Buyer | Sale Price | Title Company |
|---|---|---|---|
| Smith Everard Hall | $157,500 | -- | |
| Hollingsworth Robert Elsie | $49,000 | -- | |
| Ericksen Michael Deborah | $94,500 | -- | |
| Highsmith J Howard Betsy A | $20,000 | -- |
Source: Public Records
Tax History Compared to Growth
Tax History
| Year | Tax Paid | Tax Assessment Tax Assessment Total Assessment is a certain percentage of the fair market value that is determined by local assessors to be the total taxable value of land and additions on the property. | Land | Improvement |
|---|---|---|---|---|
| 2025 | -- | $586,100 | $104,800 | $481,300 |
| 2023 | -- | $387,700 | $80,500 | $307,200 |
| 2022 | $3,318 | $387,700 | $80,500 | $307,200 |
| 2021 | $3,318 | $387,700 | $80,500 | $307,200 |
| 2020 | $4,091 | $388,400 | $102,000 | $286,400 |
| 2019 | $4,091 | $388,400 | $102,000 | $286,400 |
| 2018 | $4,091 | $388,400 | $102,000 | $286,400 |
| 2017 | $4,091 | $388,400 | $102,000 | $286,400 |
| 2016 | $3,982 | $359,400 | $124,500 | $234,900 |
| 2015 | $3,806 | $359,400 | $124,500 | $234,900 |
| 2014 | $3,644 | $359,400 | $124,500 | $234,900 |
Source: Public Records
Map
Nearby Homes