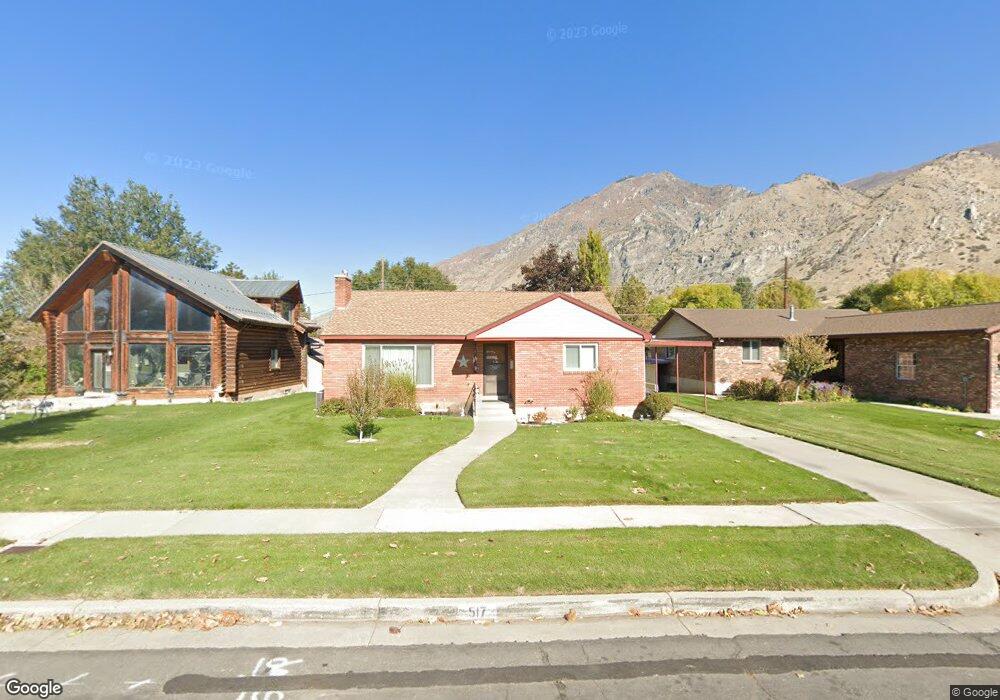
517 E 100 N Springville, UT 84663
Estimated Value: $474,000 - $542,000
5
Beds
2
Baths
2,752
Sq Ft
$184/Sq Ft
Est. Value
About This Home
This home is located at 517 E 100 N, Springville, UT 84663 and is currently estimated at $506,276, approximately $183 per square foot. 517 E 100 N is a home located in Utah County with nearby schools including Art City School, Springville Junior High School, and Springville High School.
Ownership History
Date
Name
Owned For
Owner Type
Purchase Details
Closed on
Mar 21, 2017
Sold by
Sanger Stacy L
Bought by
Sanger Stacy
Current Estimated Value
Home Financials for this Owner
Home Financials are based on the most recent Mortgage that was taken out on this home.
Original Mortgage
$106,300
Outstanding Balance
$88,150
Interest Rate
4.17%
Mortgage Type
New Conventional
Estimated Equity
$418,126
Purchase Details
Closed on
Mar 20, 2017
Sold by
Sanger Stacy
Bought by
Sanger Stacy and Sanger Lesley
Home Financials for this Owner
Home Financials are based on the most recent Mortgage that was taken out on this home.
Original Mortgage
$106,300
Outstanding Balance
$88,150
Interest Rate
4.17%
Mortgage Type
New Conventional
Estimated Equity
$418,126
Purchase Details
Closed on
Jul 19, 2011
Sold by
Fannie Mae
Bought by
Sanger Stacy L
Home Financials for this Owner
Home Financials are based on the most recent Mortgage that was taken out on this home.
Original Mortgage
$122,705
Interest Rate
4.45%
Mortgage Type
New Conventional
Purchase Details
Closed on
Mar 24, 2011
Sold by
Tipton Brandon G
Bought by
Federal National Mortgage Association
Purchase Details
Closed on
Dec 5, 2007
Sold by
Tipton Brandon G and Tipton Michelle L
Bought by
Tipton Brandon G
Home Financials for this Owner
Home Financials are based on the most recent Mortgage that was taken out on this home.
Original Mortgage
$186,300
Interest Rate
6.3%
Mortgage Type
New Conventional
Purchase Details
Closed on
Nov 3, 2004
Sold by
Tipton Brandon G
Bought by
Tipton Brandon G and Tipton Michelle L
Purchase Details
Closed on
Oct 8, 2004
Sold by
Tipton Elva R and Samuelson Marilyn
Bought by
Tipton Brandon G
Purchase Details
Closed on
Oct 7, 2004
Sold by
Tipton Elva R and Samuelson Marilyn
Bought by
Tipton Brandon G
Purchase Details
Closed on
Oct 6, 2004
Sold by
Tipton Elva R and Samuelson Marilyn
Bought by
Tipton Brandon G
Purchase Details
Closed on
Oct 5, 2004
Sold by
Tipton Elva R and Samuelson Marilyn
Bought by
Tipton Brandon G
Create a Home Valuation Report for This Property
The Home Valuation Report is an in-depth analysis detailing your home's value as well as a comparison with similar homes in the area
Home Values in the Area
Average Home Value in this Area
Purchase History
| Date | Buyer | Sale Price | Title Company |
|---|---|---|---|
| Sanger Stacy | -- | Liberty Title & Escrow Co | |
| Sanger Stacy | -- | Liberty Title Co Llc | |
| Sanger Stacy L | -- | Empire Land Title Inc | |
| Federal National Mortgage Association | $200,361 | Accommodation | |
| Tipton Brandon G | -- | Inwest Title Services Inc | |
| Tipton Brandon G | -- | Precision Title Company | |
| Tipton Brandon G | -- | Precision Title Company | |
| Tipton Brandon G | -- | Precision Title Company | |
| Tipton Brandon G | -- | Precision Title Company | |
| Tipton Brandon G | -- | Precision Title Company | |
| Tipton Brandon G | -- | Precision Title Company |
Source: Public Records
Mortgage History
| Date | Status | Borrower | Loan Amount |
|---|---|---|---|
| Open | Sanger Stacy | $106,300 | |
| Closed | Sanger Stacy L | $122,705 | |
| Previous Owner | Tipton Brandon G | $186,300 |
Source: Public Records
Tax History
| Year | Tax Paid | Tax Assessment Tax Assessment Total Assessment is a certain percentage of the fair market value that is determined by local assessors to be the total taxable value of land and additions on the property. | Land | Improvement |
|---|---|---|---|---|
| 2025 | $2,071 | $243,650 | -- | -- |
| 2024 | $2,071 | $212,135 | $0 | $0 |
| 2023 | $1,996 | $204,655 | $0 | $0 |
| 2022 | $2,267 | $228,360 | $0 | $0 |
| 2021 | $2,007 | $314,700 | $121,000 | $193,700 |
| 2020 | $1,802 | $273,900 | $89,600 | $184,300 |
| 2019 | $1,674 | $259,000 | $74,700 | $184,300 |
| 2018 | $1,556 | $229,700 | $69,400 | $160,300 |
| 2017 | $1,413 | $110,770 | $0 | $0 |
| 2016 | $1,269 | $97,570 | $0 | $0 |
| 2015 | $1,121 | $88,055 | $0 | $0 |
| 2014 | $1,081 | $84,425 | $0 | $0 |
Source: Public Records
Map
Nearby Homes
Your Personal Tour Guide
Ask me questions while you tour the home.