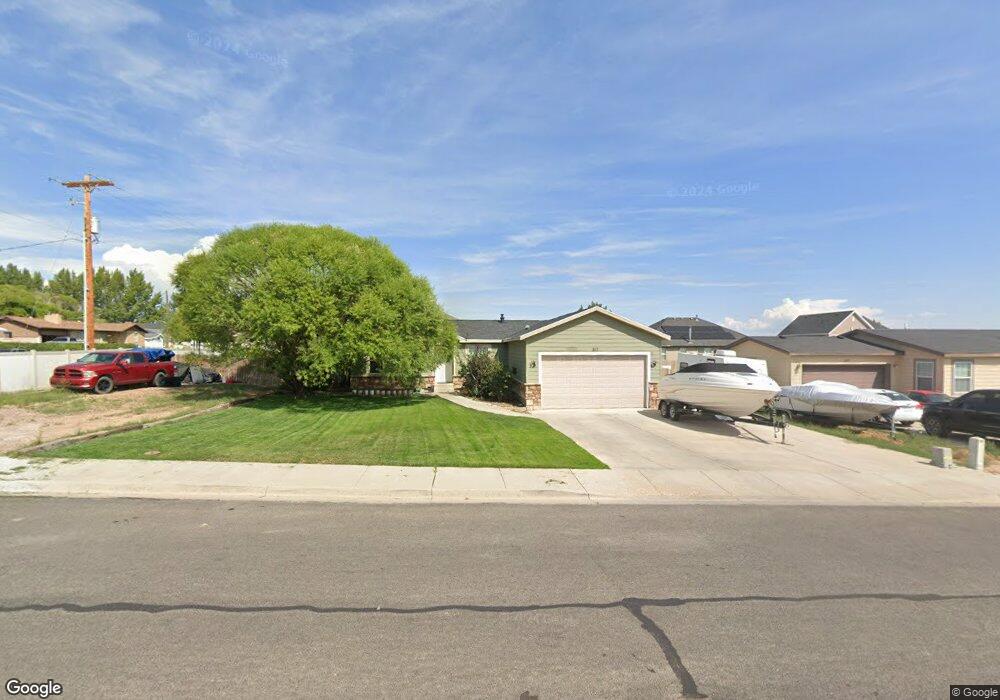
517 E 2735 S Vernal, UT 84078
Estimated Value: $309,000 - $357,000
3
Beds
2
Baths
1,327
Sq Ft
$249/Sq Ft
Est. Value
About This Home
This home is located at 517 E 2735 S, Vernal, UT 84078 and is currently estimated at $330,689, approximately $249 per square foot. 517 E 2735 S is a home located in Uintah County with nearby schools including Davis School, Vernal Middle School, and Uintah Middle School.
Ownership History
Date
Name
Owned For
Owner Type
Purchase Details
Closed on
Aug 23, 2024
Sold by
Wright Dillon Hal and Conner Madison
Bought by
Jacobson Elizabeth
Current Estimated Value
Home Financials for this Owner
Home Financials are based on the most recent Mortgage that was taken out on this home.
Original Mortgage
$11,947
Outstanding Balance
$11,823
Interest Rate
6.89%
Estimated Equity
$318,866
Purchase Details
Closed on
Nov 5, 2020
Sold by
Wright Dilloh H
Bought by
Hal-Wright Dilloh and Madison-Wright Conner
Home Financials for this Owner
Home Financials are based on the most recent Mortgage that was taken out on this home.
Original Mortgage
$120,000
Interest Rate
2.8%
Mortgage Type
New Conventional
Purchase Details
Closed on
Sep 30, 2008
Sold by
Pheasant Run Estates One Llc
Bought by
Ortiz Alvarado Teofilo D J
Home Financials for this Owner
Home Financials are based on the most recent Mortgage that was taken out on this home.
Original Mortgage
$197,395
Interest Rate
6.43%
Mortgage Type
FHA
Create a Home Valuation Report for This Property
The Home Valuation Report is an in-depth analysis detailing your home's value as well as a comparison with similar homes in the area
Home Values in the Area
Average Home Value in this Area
Purchase History
| Date | Buyer | Sale Price | Title Company |
|---|---|---|---|
| Jacobson Elizabeth | -- | Truly Title | |
| Hal-Wright Dilloh | -- | None Available | |
| Ortiz Alvarado Teofilo D J | -- | -- |
Source: Public Records
Mortgage History
| Date | Status | Borrower | Loan Amount |
|---|---|---|---|
| Open | Jacobson Elizabeth | $11,947 | |
| Open | Jacobson Elizabeth | $325,004 | |
| Previous Owner | Hal-Wright Dilloh | $120,000 | |
| Previous Owner | Ortiz Alvarado Teofilo D J | $197,395 |
Source: Public Records
Tax History Compared to Growth
Tax History
| Year | Tax Paid | Tax Assessment Tax Assessment Total Assessment is a certain percentage of the fair market value that is determined by local assessors to be the total taxable value of land and additions on the property. | Land | Improvement |
|---|---|---|---|---|
| 2024 | $1,342 | $155,015 | $15,752 | $139,263 |
| 2023 | $1,342 | $111,796 | $15,752 | $96,044 |
| 2022 | $919 | $86,373 | $15,752 | $70,621 |
| 2021 | $975 | $75,600 | $15,752 | $59,848 |
| 2020 | $939 | $74,742 | $16,500 | $58,242 |
| 2019 | $951 | $74,742 | $16,500 | $58,242 |
| 2018 | $949 | $74,742 | $16,500 | $58,242 |
| 2017 | $9 | $74,742 | $16,500 | $58,242 |
| 2016 | $995 | $85,836 | $16,500 | $69,336 |
| 2015 | $966 | $90,267 | $13,750 | $76,517 |
| 2014 | $957 | $90,267 | $13,750 | $76,517 |
| 2013 | $977 | $90,267 | $13,750 | $76,517 |
Source: Public Records
Map
Nearby Homes