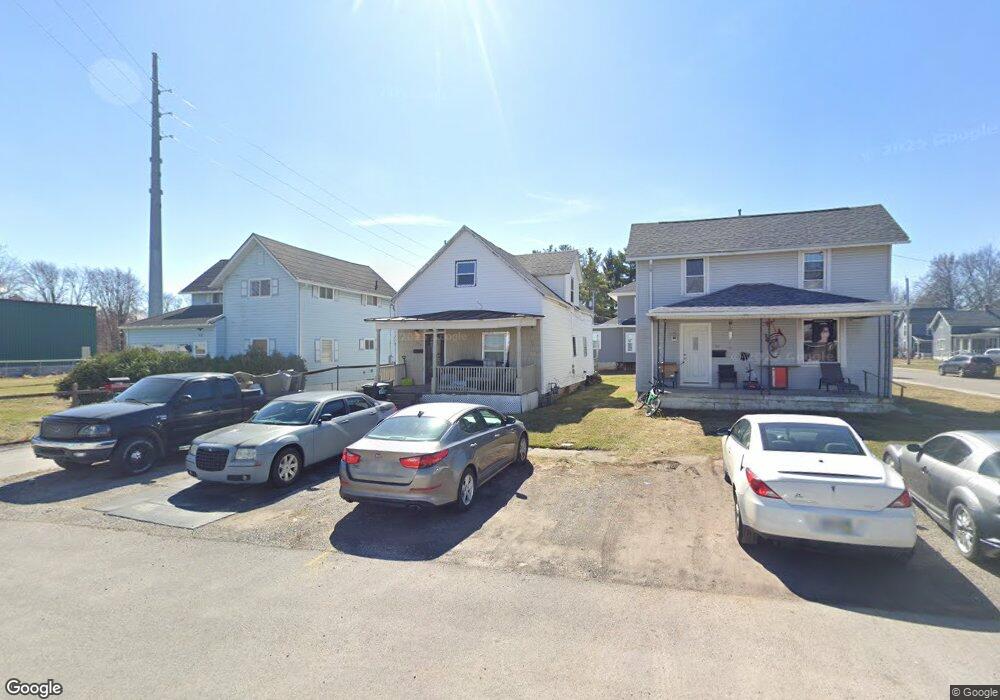
517 E Lima St Findlay, OH 45840
Estimated Value: $129,603 - $158,000
Studio
1
Bath
1,200
Sq Ft
$118/Sq Ft
Est. Value
About This Home
This home is located at 517 E Lima St, Findlay, OH 45840 and is currently estimated at $141,401, approximately $117 per square foot. 517 E Lima St is a home located in Hancock County with nearby schools including Lincoln Elementary School, Donnell Middle School, and Findlay High School.
Ownership History
Date
Name
Owned For
Owner Type
Purchase Details
Closed on
Apr 29, 2009
Sold by
Chiow Diana J and Chiow Diane J
Bought by
Richards John L and Richards Angela C
Current Estimated Value
Home Financials for this Owner
Home Financials are based on the most recent Mortgage that was taken out on this home.
Original Mortgage
$46,900
Interest Rate
8%
Mortgage Type
Seller Take Back
Purchase Details
Closed on
Feb 20, 1990
Bought by
Chiow Diane J
Create a Home Valuation Report for This Property
The Home Valuation Report is an in-depth analysis detailing your home's value as well as a comparison with similar homes in the area
Home Values in the Area
Average Home Value in this Area
Purchase History
| Date | Buyer | Sale Price | Title Company |
|---|---|---|---|
| Richards John L | $49,900 | Assured Title | |
| Chiow Diane J | $5,000 | -- |
Source: Public Records
Mortgage History
| Date | Status | Borrower | Loan Amount |
|---|---|---|---|
| Closed | Richards John L | $46,900 |
Source: Public Records
Tax History
| Year | Tax Paid | Tax Assessment Tax Assessment Total Assessment is a certain percentage of the fair market value that is determined by local assessors to be the total taxable value of land and additions on the property. | Land | Improvement |
|---|---|---|---|---|
| 2024 | $1,276 | $35,010 | $2,540 | $32,470 |
| 2023 | $1,278 | $35,010 | $2,540 | $32,470 |
| 2022 | $1,274 | $35,010 | $2,540 | $32,470 |
| 2021 | $1,029 | $24,630 | $2,550 | $22,080 |
| 2020 | $1,029 | $24,630 | $2,550 | $22,080 |
| 2019 | $1,008 | $24,630 | $2,550 | $22,080 |
| 2018 | $958 | $21,420 | $2,220 | $19,200 |
| 2017 | $478 | $21,420 | $2,220 | $19,200 |
| 2016 | $954 | $21,420 | $2,220 | $19,200 |
| 2015 | $582 | $12,940 | $2,040 | $10,900 |
| 2014 | $582 | $12,940 | $2,040 | $10,900 |
| 2012 | $597 | $13,100 | $2,040 | $11,060 |
Source: Public Records
Map
Nearby Homes
- 829 Maple Ave
- 216 1st St
- 865 S Main St
- 623 E Sandusky St
- 815 Liberty St
- 514 Liberty St
- 123 Glendale Ave
- 15591 Canadian Way
- 15586 Canadian Way
- 15615 Canadian Way
- 206 Greenlawn Ave
- 412 Lima Ave
- 845 Hurd Ave
- 423 Elm St
- 860 Hurd Ave
- 731 5th St
- 1113 Hurd Ave
- 523 Center St
- 655 Clinton Ct
- 527 W Sandusky St
Your Personal Tour Guide
Ask me questions while you tour the home.