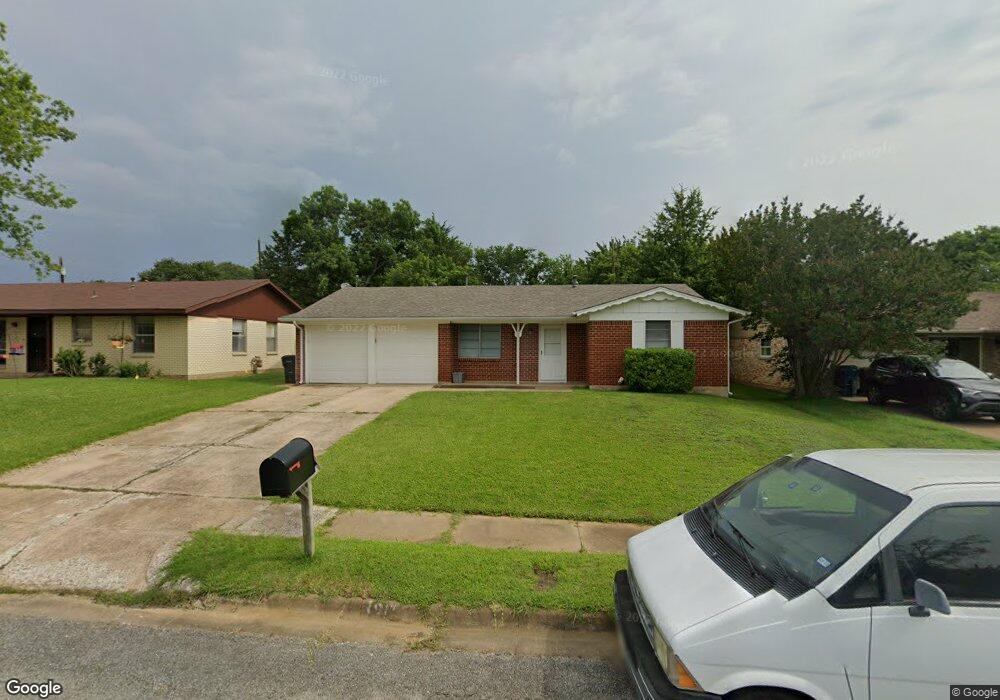
517 Joy Ln Denison, TX 75021
Estimated Value: $195,323 - $233,000
3
Beds
2
Baths
1,194
Sq Ft
$179/Sq Ft
Est. Value
About This Home
This home is located at 517 Joy Ln, Denison, TX 75021 and is currently estimated at $214,162, approximately $179 per square foot. 517 Joy Ln is a home located in Grayson County with nearby schools including Scott Middle School, Denison High School, and St. Luke's Parish Day School.
Ownership History
Date
Name
Owned For
Owner Type
Purchase Details
Closed on
Aug 21, 2020
Sold by
Makinson Susan and Makinson Doris Tankersley
Bought by
Brockett Scott B
Current Estimated Value
Home Financials for this Owner
Home Financials are based on the most recent Mortgage that was taken out on this home.
Original Mortgage
$130,950
Outstanding Balance
$115,945
Interest Rate
2.9%
Mortgage Type
New Conventional
Estimated Equity
$98,217
Create a Home Valuation Report for This Property
The Home Valuation Report is an in-depth analysis detailing your home's value as well as a comparison with similar homes in the area
Home Values in the Area
Average Home Value in this Area
Purchase History
| Date | Buyer | Sale Price | Title Company |
|---|---|---|---|
| Brockett Scott B | -- | Red River Title Co |
Source: Public Records
Mortgage History
| Date | Status | Borrower | Loan Amount |
|---|---|---|---|
| Open | Brockett Scott B | $130,950 |
Source: Public Records
Tax History
| Year | Tax Paid | Tax Assessment Tax Assessment Total Assessment is a certain percentage of the fair market value that is determined by local assessors to be the total taxable value of land and additions on the property. | Land | Improvement |
|---|---|---|---|---|
| 2025 | $2,824 | $193,037 | $38,976 | $154,061 |
| 2024 | $4,100 | $176,461 | $0 | $0 |
| 2023 | $2,365 | $160,419 | $0 | $0 |
| 2022 | $3,465 | $145,835 | $0 | $0 |
| 2021 | $3,344 | $132,577 | $16,212 | $116,365 |
| 2020 | $2,667 | $101,091 | $16,212 | $84,879 |
| 2019 | $2,705 | $98,300 | $10,752 | $87,548 |
| 2018 | $2,645 | $95,335 | $10,752 | $84,583 |
| 2017 | $2,421 | $86,547 | $10,752 | $75,795 |
| 2016 | $2,064 | $73,792 | $10,752 | $63,040 |
Source: Public Records
Map
Nearby Homes
- 227 Sheryl Ln
- 40 Sheryl Ln
- 903 Seymore Cir
- 905 Seymore Cir
- 700 Dubois St
- 711 Dubois St
- 618 Star St
- 3101 S College Blvd
- 701 W Star St
- 901 Dubois St
- 603 W Star St
- 611 W Baker St
- 607 W Baker St
- 3312 Vine Ln
- 2526 S Fannin Ave Unit 2600
- 614 Rice St
- 1130 Amsden Cir
- 916 W Collins St
- 513 W Coffin St
- 509 W Coffin St
Your Personal Tour Guide
Ask me questions while you tour the home.