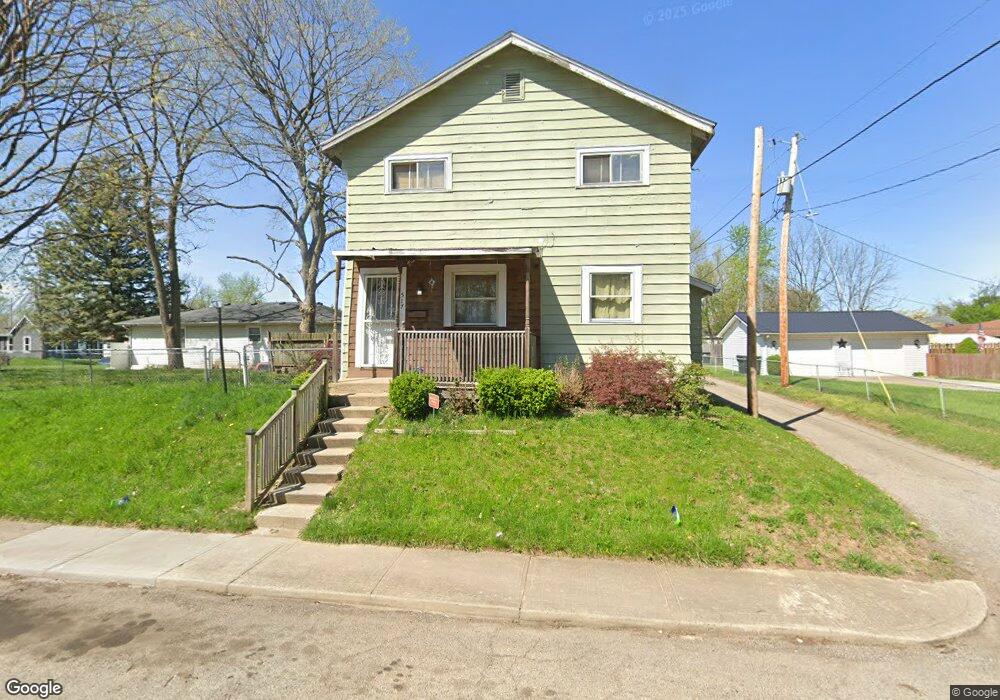
517 Locust St Anderson, IN 46016
Estimated Value: $91,000 - $141,000
3
Beds
2
Baths
2,240
Sq Ft
$48/Sq Ft
Est. Value
About This Home
This home is located at 517 Locust St, Anderson, IN 46016 and is currently estimated at $108,527, approximately $48 per square foot. 517 Locust St is a home located in Madison County with nearby schools including Eastside Elementary School, Highland Middle School, and Anderson High School.
Ownership History
Date
Name
Owned For
Owner Type
Purchase Details
Closed on
May 23, 2023
Sold by
Blackstar Stability Distressed Debt Fund
Bought by
Raymore Victor and Raymore Violet
Current Estimated Value
Home Financials for this Owner
Home Financials are based on the most recent Mortgage that was taken out on this home.
Original Mortgage
$38,500
Outstanding Balance
$37,429
Interest Rate
6.39%
Mortgage Type
New Conventional
Estimated Equity
$71,098
Purchase Details
Closed on
Oct 2, 2020
Sold by
Home American Fund Iii Lp
Bought by
Blackstar Stability Distressed Debt Fund
Purchase Details
Closed on
Dec 12, 2013
Sold by
Home America Llc
Bought by
Home America Fund Iii Lp
Purchase Details
Closed on
Jul 20, 2012
Sold by
Eldridge Phyllis D
Bought by
Federal National Mortgage Association
Create a Home Valuation Report for This Property
The Home Valuation Report is an in-depth analysis detailing your home's value as well as a comparison with similar homes in the area
Home Values in the Area
Average Home Value in this Area
Purchase History
| Date | Buyer | Sale Price | Title Company |
|---|---|---|---|
| Raymore Victor | $38,500 | Stewart Title | |
| Blackstar Stability Distressed Debt Fund | $23,845 | None Available | |
| Home America Fund Iii Lp | -- | -- | |
| Federal National Mortgage Association | -- | None Available |
Source: Public Records
Mortgage History
| Date | Status | Borrower | Loan Amount |
|---|---|---|---|
| Open | Raymore Victor | $38,500 |
Source: Public Records
Tax History Compared to Growth
Tax History
| Year | Tax Paid | Tax Assessment Tax Assessment Total Assessment is a certain percentage of the fair market value that is determined by local assessors to be the total taxable value of land and additions on the property. | Land | Improvement |
|---|---|---|---|---|
| 2024 | $634 | $60,100 | $5,800 | $54,300 |
| 2023 | $1,228 | $54,900 | $5,500 | $49,400 |
| 2022 | $1,239 | $55,400 | $5,500 | $49,900 |
| 2021 | $1,073 | $47,700 | $5,200 | $42,500 |
| 2020 | $1,030 | $45,600 | $4,900 | $40,700 |
| 2019 | $1,004 | $44,400 | $4,900 | $39,500 |
| 2018 | $944 | $40,900 | $4,900 | $36,000 |
| 2017 | $810 | $40,500 | $4,900 | $35,600 |
| 2016 | $810 | $40,500 | $4,900 | $35,600 |
| 2014 | $814 | $40,700 | $5,000 | $35,700 |
| 2013 | $814 | $40,700 | $5,000 | $35,700 |
Source: Public Records
Map
Nearby Homes