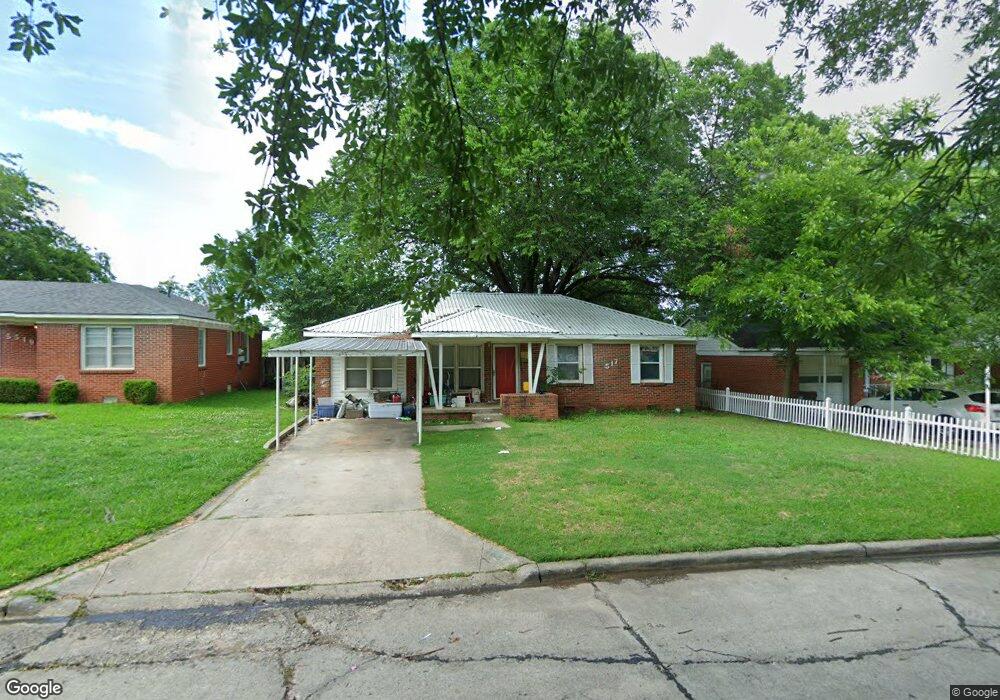
517 Locust St Ardmore, OK 73401
Estimated Value: $117,432 - $150,000
3
Beds
2
Baths
1,288
Sq Ft
$102/Sq Ft
Est. Value
About This Home
This home is located at 517 Locust St, Ardmore, OK 73401 and is currently estimated at $131,108, approximately $101 per square foot. 517 Locust St is a home located in Carter County with nearby schools including Charles Evans Elementary School, Ardmore Middle School, and Ardmore High School.
Ownership History
Date
Name
Owned For
Owner Type
Purchase Details
Closed on
May 5, 2022
Sold by
Tynes Investments Llc
Bought by
649 Acorn Llc
Current Estimated Value
Purchase Details
Closed on
Jun 19, 2014
Sold by
Rossman Charles W and Rossma Brunhilde C
Bought by
Tynes Investments Llc
Purchase Details
Closed on
Sep 18, 1997
Sold by
Rossman Charles
Bought by
Rossman Charles and Rossman Brun
Create a Home Valuation Report for This Property
The Home Valuation Report is an in-depth analysis detailing your home's value as well as a comparison with similar homes in the area
Home Values in the Area
Average Home Value in this Area
Purchase History
| Date | Buyer | Sale Price | Title Company |
|---|---|---|---|
| 649 Acorn Llc | -- | None Listed On Document | |
| Tynes Investments Llc | $124,750 | Stewart Abstract & Title | |
| Rossman Charles | -- | -- |
Source: Public Records
Tax History Compared to Growth
Tax History
| Year | Tax Paid | Tax Assessment Tax Assessment Total Assessment is a certain percentage of the fair market value that is determined by local assessors to be the total taxable value of land and additions on the property. | Land | Improvement |
|---|---|---|---|---|
| 2025 | $1,066 | $9,665 | $1,200 | $8,465 |
| 2024 | $1,066 | $10,797 | $1,200 | $9,597 |
| 2023 | $1,016 | $10,283 | $1,200 | $9,083 |
| 2022 | $936 | $9,794 | $1,200 | $8,594 |
| 2021 | $941 | $9,327 | $1,200 | $8,127 |
| 2020 | $957 | $9,628 | $720 | $8,908 |
| 2019 | $935 | $9,628 | $720 | $8,908 |
| 2018 | $950 | $9,628 | $720 | $8,908 |
| 2017 | $853 | $9,329 | $720 | $8,609 |
| 2016 | $828 | $8,885 | $720 | $8,165 |
| 2015 | $705 | $9,180 | $918 | $8,262 |
| 2014 | $385 | $5,006 | $306 | $4,700 |
Source: Public Records
Map
Nearby Homes
- 434 Locust St NW
- 430 Locust St
- 1817 Comanche St
- 703 Cottonwood St
- 800 Cottonwood St
- 715 Ash St
- 132 Veterans Blvd
- 1740 Tiverton St
- 505 Campbell St
- 1714 Salisbury St
- 1750 Mount Washington Rd
- 1907 Robison St
- 723 Maxwell St NW
- 722 Maxwell St NW
- 912 Elm St
- 912 Maxwell St NW
- 809 Campbell St
- 923 Maxwell St NW
- 0 15th Unit 2546881
- 00 N Rockford Rd