Estimated Value: $62,317 - $84,000
2
Beds
1
Bath
1,000
Sq Ft
$75/Sq Ft
Est. Value
About This Home
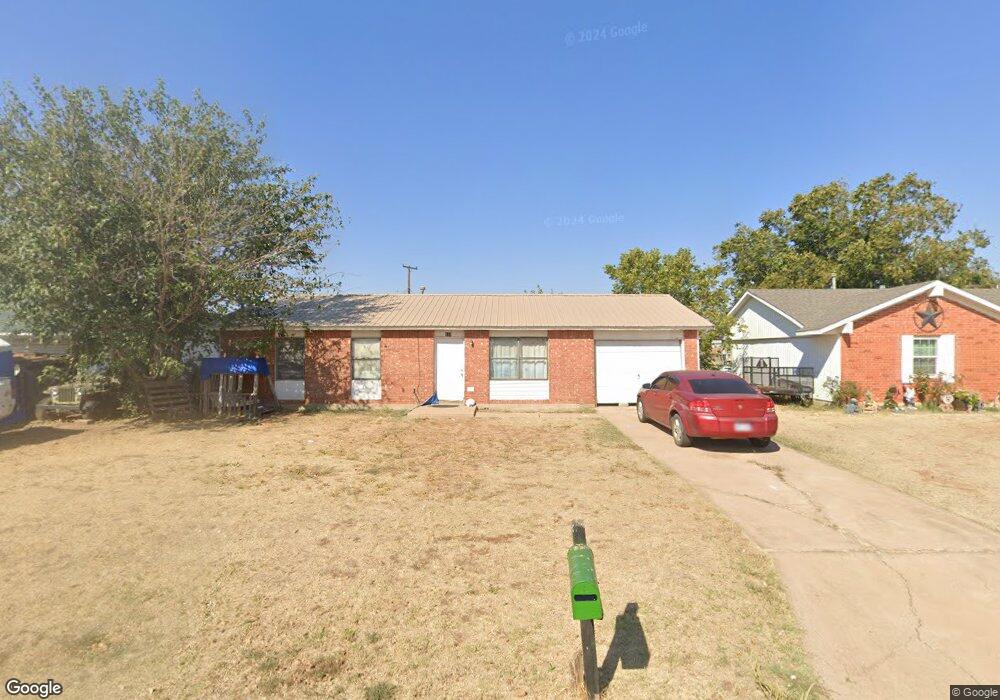
This home is located at 517 Mercury St, Altus, OK 73521 and is currently estimated at $75,079, approximately $75 per square foot. 517 Mercury St is a home located in Jackson County with nearby schools including Altus High School and Altus Christian Academy.
Ownership History
Date
Name
Owned For
Owner Type
Purchase Details
Closed on
Dec 31, 2010
Sold by
Redbud Homes Llc
Bought by
Dwg Properties Llc
Current Estimated Value
Home Financials for this Owner
Home Financials are based on the most recent Mortgage that was taken out on this home.
Original Mortgage
$23,383
Outstanding Balance
$15,558
Interest Rate
4.36%
Mortgage Type
Future Advance Clause Open End Mortgage
Estimated Equity
$59,521
Purchase Details
Closed on
Dec 7, 2010
Sold by
Huffman Joseph M
Bought by
Redbud Homes Llc
Home Financials for this Owner
Home Financials are based on the most recent Mortgage that was taken out on this home.
Original Mortgage
$23,383
Outstanding Balance
$15,558
Interest Rate
4.36%
Mortgage Type
Future Advance Clause Open End Mortgage
Estimated Equity
$59,521
Purchase Details
Closed on
Oct 1, 1995
Sold by
Bianchi Bradley A
Purchase Details
Closed on
Sep 10, 1993
Sold by
Hall Kelly and Hall Helena
Create a Home Valuation Report for This Property
The Home Valuation Report is an in-depth analysis detailing your home's value as well as a comparison with similar homes in the area
Purchase History
| Date | Buyer | Sale Price | Title Company |
|---|---|---|---|
| Dwg Properties Llc | $22,279 | None Available | |
| Redbud Homes Llc | $24,987 | None Available | |
| -- | $33,200 | -- | |
| -- | $34,000 | -- |
Source: Public Records
Mortgage History
| Date | Status | Borrower | Loan Amount |
|---|---|---|---|
| Open | Dwg Properties Llc | $23,383 |
Source: Public Records
Tax History
| Year | Tax Paid | Tax Assessment Tax Assessment Total Assessment is a certain percentage of the fair market value that is determined by local assessors to be the total taxable value of land and additions on the property. | Land | Improvement |
|---|---|---|---|---|
| 2025 | $516 | $5,979 | $1,368 | $4,611 |
| 2024 | $497 | $6,017 | $1,357 | $4,660 |
| 2023 | $497 | $5,458 | $1,273 | $4,185 |
| 2022 | $440 | $5,197 | $1,228 | $3,969 |
| 2021 | $423 | $4,950 | $1,155 | $3,795 |
| 2020 | $408 | $4,715 | $1,075 | $3,640 |
| 2019 | $392 | $4,490 | $990 | $3,500 |
| 2018 | $319 | $4,276 | $934 | $3,342 |
| 2017 | $304 | $4,073 | $881 | $3,192 |
| 2016 | $290 | $3,879 | $830 | $3,049 |
| 2015 | $276 | $3,694 | $780 | $2,914 |
| 2014 | $276 | $3,702 | $780 | $2,922 |
Source: Public Records
Map
Nearby Homes
- 408 Libra St
- 404 Mercury St
- 1613 Sommerset Place
- 1605 Sommerset Place
- 1601 Sommerset Place
- 313 Mercury St
- 304 Saturn St
- 1512 Sommerset Place
- 1205 S Main St
- 1313 Inis St
- 1103 Asalee St
- 1011 Eula St
- 1308 Karen Dr
- 915 Hickory St
- 1712 Scott
- 1137 E Chestnut St
- 1009 Stewart St
- 1016 E Pecan St
- 0 Please See Legal Unit 1190296
- 1038 E Walnut St
Your Personal Tour Guide
Ask me questions while you tour the home.