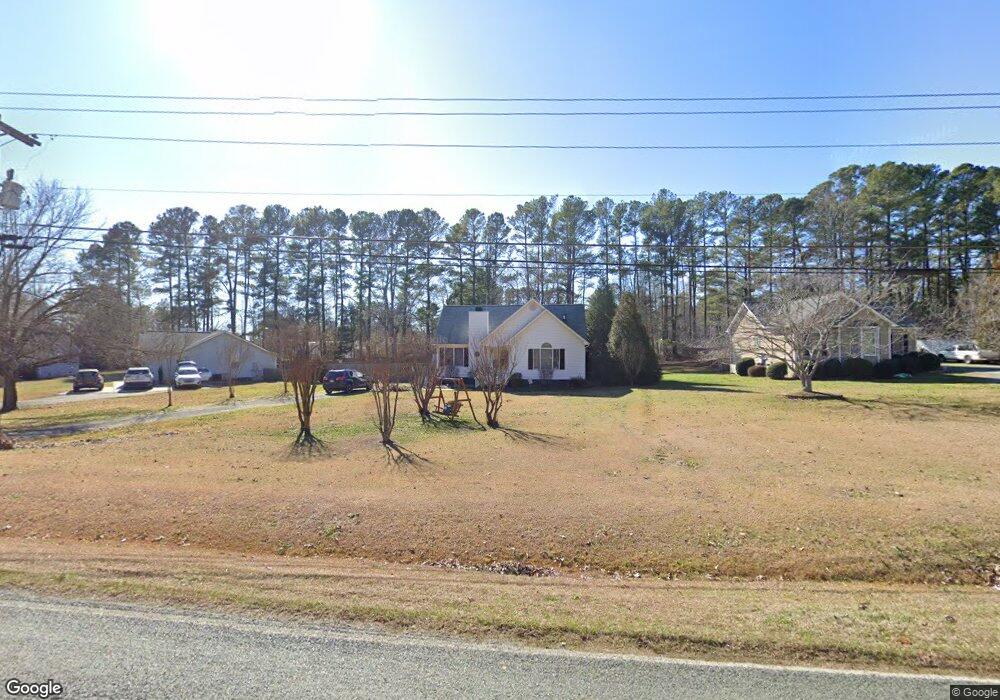
517 Old Graham Rd Pittsboro, NC 27312
Estimated Value: $296,000 - $364,000
3
Beds
2
Baths
1,230
Sq Ft
$268/Sq Ft
Est. Value
About This Home
This home is located at 517 Old Graham Rd, Pittsboro, NC 27312 and is currently estimated at $330,239, approximately $268 per square foot. 517 Old Graham Rd is a home located in Chatham County with nearby schools including Pittsboro Elementary School, George Moses Horton Middle School, and Northwood High.
Ownership History
Date
Name
Owned For
Owner Type
Purchase Details
Closed on
May 2, 2019
Sold by
Faust Thomas J and Faust Betsy T
Bought by
Baugher Justin and Baugher Ashley
Current Estimated Value
Home Financials for this Owner
Home Financials are based on the most recent Mortgage that was taken out on this home.
Original Mortgage
$192,500
Outstanding Balance
$171,136
Interest Rate
4.87%
Mortgage Type
Adjustable Rate Mortgage/ARM
Estimated Equity
$159,103
Purchase Details
Closed on
Nov 2, 2009
Sold by
Watts William Harold and Smith Tami Michelle
Bought by
Faust Thomas J and Faust Betsy T
Home Financials for this Owner
Home Financials are based on the most recent Mortgage that was taken out on this home.
Original Mortgage
$158,967
Interest Rate
4.93%
Mortgage Type
FHA
Create a Home Valuation Report for This Property
The Home Valuation Report is an in-depth analysis detailing your home's value as well as a comparison with similar homes in the area
Home Values in the Area
Average Home Value in this Area
Purchase History
| Date | Buyer | Sale Price | Title Company |
|---|---|---|---|
| Baugher Justin | $192,500 | None Available | |
| Faust Thomas J | $162,000 | None Available |
Source: Public Records
Mortgage History
| Date | Status | Borrower | Loan Amount |
|---|---|---|---|
| Open | Baugher Justin | $192,500 | |
| Previous Owner | Faust Thomas J | $158,967 |
Source: Public Records
Tax History Compared to Growth
Tax History
| Year | Tax Paid | Tax Assessment Tax Assessment Total Assessment is a certain percentage of the fair market value that is determined by local assessors to be the total taxable value of land and additions on the property. | Land | Improvement |
|---|---|---|---|---|
| 2025 | $3,019 | $266,747 | $66,830 | $199,917 |
| 2024 | $3,019 | $191,892 | $65,200 | $126,692 |
| 2023 | $2,471 | $191,892 | $65,200 | $126,692 |
| 2022 | $2,330 | $191,892 | $65,200 | $126,692 |
| 2021 | $2,308 | $191,892 | $65,200 | $126,692 |
| 2020 | $1,960 | $159,932 | $44,825 | $115,107 |
| 2019 | $1,950 | $159,932 | $44,825 | $115,107 |
| 2018 | $1,863 | $159,932 | $44,825 | $115,107 |
| 2017 | $1,863 | $159,932 | $44,825 | $115,107 |
| 2016 | $1,733 | $146,897 | $40,750 | $106,147 |
| 2015 | $1,715 | $146,897 | $40,750 | $106,147 |
| 2014 | $1,715 | $146,897 | $40,750 | $106,147 |
| 2013 | -- | $146,897 | $40,750 | $106,147 |
Source: Public Records
Map
Nearby Homes
- 248 Ashford Dr
- 230 Oakwood Dr
- 507 W Salisbury St
- 425 Credle St
- 0 N Carolina 902
- 00 N Carolina 902
- 116 Kensington Dr
- 54 Pattishall Rd
- 162 Gaines Trail
- 000 Alston Chapel Rd
- 298 E Salisbury St
- 1157 Hillsboro St
- 66 Toomer Loop Rd
- Tbd Versailles Ln
- 24 Cynthia Ln
- 726 Thompson St
- 73 Freeman Dr
- 41 Cottage Way
- 26 Danbury Ct
- 0 Nc 87 Hwy Unit 2491586
- 545 Old Graham Rd
- 485 Old Graham Rd
- 467 Old Graham Rd
- 565 Old Graham Rd
- 488 Nc Highway 87 N
- TBD N Nc 87 Hwy
- TBD N Nc Highway 87
- 482 Old Graham Rd
- 488 N Carolina 87
- 464 Nc Highway 87 N
- 464 N Carolina 87
- 536 Nc Highway 87 N
- 425 Nc Highway 87 N
- 425 Old Graham Rd
- 434 Nc Highway 87 N
- 564 Nc Highway 87 N
- 399 Old Graham Rd
- 582 Nc Highway 87 N
- 412 N Carolina 87
- 582 N Carolina 87