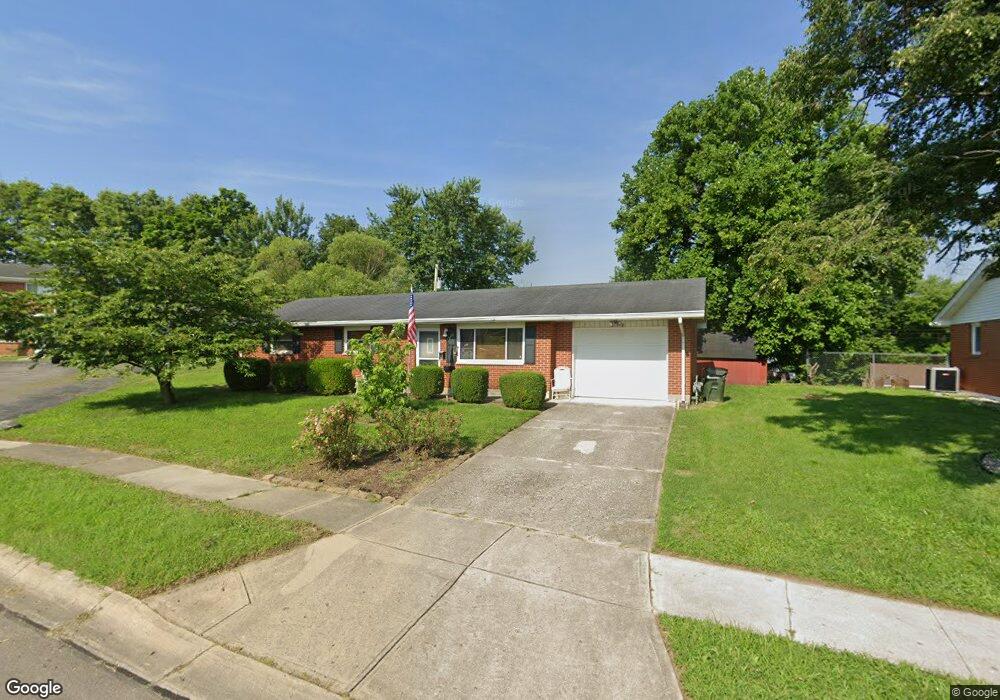
517 Rosetta Ave Miamisburg, OH 45342
Downtown Miamisburg NeighborhoodEstimated Value: $196,000 - $215,844
3
Beds
2
Baths
1,032
Sq Ft
$201/Sq Ft
Est. Value
About This Home
This home is located at 517 Rosetta Ave, Miamisburg, OH 45342 and is currently estimated at $207,211, approximately $200 per square foot. 517 Rosetta Ave is a home located in Montgomery County with nearby schools including Miamisburg High School and Bethel Baptist School.
Ownership History
Date
Name
Owned For
Owner Type
Purchase Details
Closed on
Dec 19, 2016
Sold by
Southerland Carson Kilbreth
Bought by
Southerland Kenneth Wayne and Southerland Family Irrevocable
Current Estimated Value
Purchase Details
Closed on
Dec 1, 2015
Sold by
Grim Erin
Bought by
Southerland Carson K
Purchase Details
Closed on
Jan 3, 2002
Sold by
Stone Jeffrey C
Bought by
Grim Erin
Home Financials for this Owner
Home Financials are based on the most recent Mortgage that was taken out on this home.
Original Mortgage
$86,715
Interest Rate
6.87%
Mortgage Type
FHA
Purchase Details
Closed on
Dec 20, 2001
Sold by
Stone Elisabeth A
Bought by
Grim Erin
Home Financials for this Owner
Home Financials are based on the most recent Mortgage that was taken out on this home.
Original Mortgage
$86,715
Interest Rate
6.87%
Mortgage Type
FHA
Create a Home Valuation Report for This Property
The Home Valuation Report is an in-depth analysis detailing your home's value as well as a comparison with similar homes in the area
Home Values in the Area
Average Home Value in this Area
Purchase History
| Date | Buyer | Sale Price | Title Company |
|---|---|---|---|
| Southerland Kenneth Wayne | -- | None Available | |
| Southerland Carson K | -- | Attorney | |
| Grim Erin | $87,400 | -- | |
| Grim Erin | $87,400 | -- |
Source: Public Records
Mortgage History
| Date | Status | Borrower | Loan Amount |
|---|---|---|---|
| Previous Owner | Grim Erin | $86,715 | |
| Previous Owner | Grim Erin | $86,715 |
Source: Public Records
Tax History Compared to Growth
Tax History
| Year | Tax Paid | Tax Assessment Tax Assessment Total Assessment is a certain percentage of the fair market value that is determined by local assessors to be the total taxable value of land and additions on the property. | Land | Improvement |
|---|---|---|---|---|
| 2024 | $2,944 | $55,420 | $12,250 | $43,170 |
| 2023 | $2,944 | $55,420 | $12,250 | $43,170 |
| 2022 | $2,333 | $39,590 | $8,750 | $30,840 |
| 2021 | $2,065 | $39,590 | $8,750 | $30,840 |
| 2020 | $2,060 | $39,590 | $8,750 | $30,840 |
| 2019 | $1,845 | $34,060 | $8,750 | $25,310 |
| 2018 | $1,851 | $34,060 | $8,750 | $25,310 |
| 2017 | $1,838 | $34,060 | $8,750 | $25,310 |
| 2016 | $1,600 | $29,940 | $8,750 | $21,190 |
| 2015 | $2,207 | $29,940 | $8,750 | $21,190 |
| 2014 | $2,207 | $29,940 | $8,750 | $21,190 |
| 2012 | -- | $35,430 | $10,500 | $24,930 |
Source: Public Records
Map
Nearby Homes
- 460 S 8th St
- 1331 Cherry Hill Dr
- 619 Jefferson St
- 513 Mound Ave
- 235 S 7th St
- 805 E Linden Ave
- 727 Harnam Ct
- 736 Park Ave
- 24 S 8th St
- 1132 Nouvelle Dr
- 740 E Central Ave
- 811 Moon Ct
- 230 Floyd Ave
- 832 E Maple Ave
- 607 E Central Ave
- 233 Woodridge Dr
- 1045 S Linden Ave
- 816 E Pearl St
- 150 S Main St
- 1013 S Heincke Rd