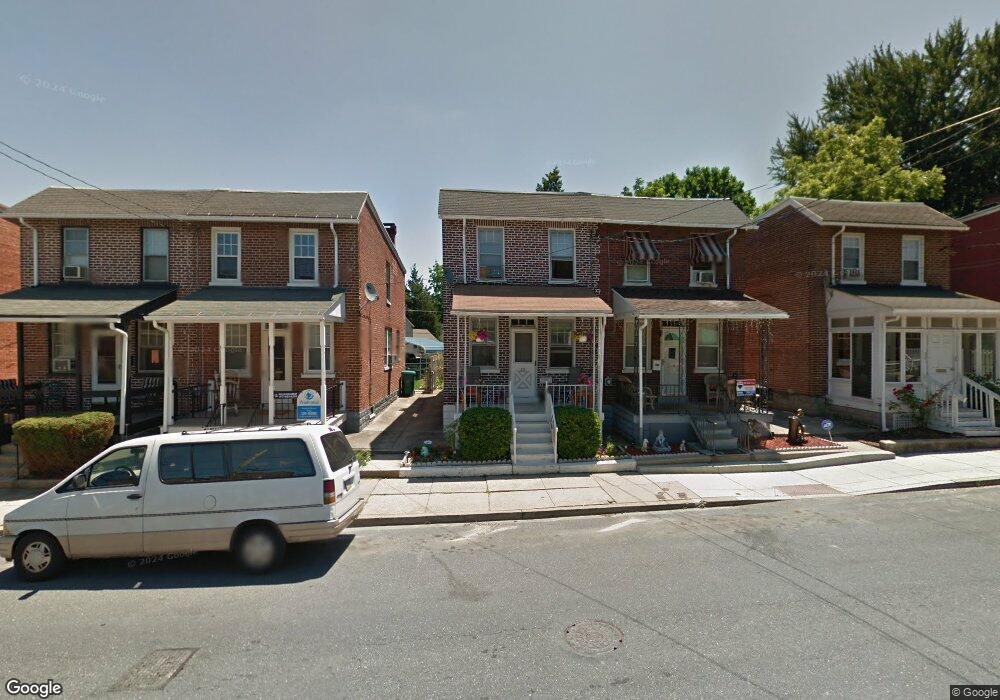
517 Ruby St Lancaster, PA 17603
West End NeighborhoodEstimated Value: $203,000 - $214,000
3
Beds
1
Bath
1,088
Sq Ft
$191/Sq Ft
Est. Value
About This Home
This home is located at 517 Ruby St, Lancaster, PA 17603 and is currently estimated at $208,150, approximately $191 per square foot. 517 Ruby St is a home located in Lancaster County with nearby schools including Smith-Wade-El Elementary School, Wheatland Middle School, and McCaskey High School.
Ownership History
Date
Name
Owned For
Owner Type
Purchase Details
Closed on
Aug 10, 2007
Sold by
Bowers Denise E
Bought by
Cancela Pedro H
Current Estimated Value
Home Financials for this Owner
Home Financials are based on the most recent Mortgage that was taken out on this home.
Original Mortgage
$95,060
Outstanding Balance
$60,218
Interest Rate
6.67%
Mortgage Type
Purchase Money Mortgage
Estimated Equity
$147,932
Purchase Details
Closed on
Jan 13, 2004
Sold by
Bowers Denise E
Bought by
Bowers Denise E
Create a Home Valuation Report for This Property
The Home Valuation Report is an in-depth analysis detailing your home's value as well as a comparison with similar homes in the area
Home Values in the Area
Average Home Value in this Area
Purchase History
| Date | Buyer | Sale Price | Title Company |
|---|---|---|---|
| Cancela Pedro H | $98,000 | None Available | |
| Bowers Denise E | -- | -- |
Source: Public Records
Mortgage History
| Date | Status | Borrower | Loan Amount |
|---|---|---|---|
| Open | Cancela Pedro H | $95,060 |
Source: Public Records
Tax History
| Year | Tax Paid | Tax Assessment Tax Assessment Total Assessment is a certain percentage of the fair market value that is determined by local assessors to be the total taxable value of land and additions on the property. | Land | Improvement |
|---|---|---|---|---|
| 2025 | $3,494 | $88,300 | $24,000 | $64,300 |
| 2024 | $3,494 | $88,300 | $24,000 | $64,300 |
| 2023 | $3,435 | $88,300 | $24,000 | $64,300 |
| 2022 | $3,292 | $88,300 | $24,000 | $64,300 |
| 2021 | $3,222 | $88,300 | $24,000 | $64,300 |
| 2020 | $3,222 | $88,300 | $24,000 | $64,300 |
| 2019 | $3,173 | $88,300 | $24,000 | $64,300 |
| 2018 | $1,446 | $88,300 | $24,000 | $64,300 |
| 2017 | $2,710 | $59,000 | $14,900 | $44,100 |
| 2016 | $2,685 | $59,000 | $14,900 | $44,100 |
| 2015 | $1,048 | $59,000 | $14,900 | $44,100 |
| 2014 | $1,916 | $59,000 | $14,900 | $44,100 |
Source: Public Records
Map
Nearby Homes
Your Personal Tour Guide
Ask me questions while you tour the home.