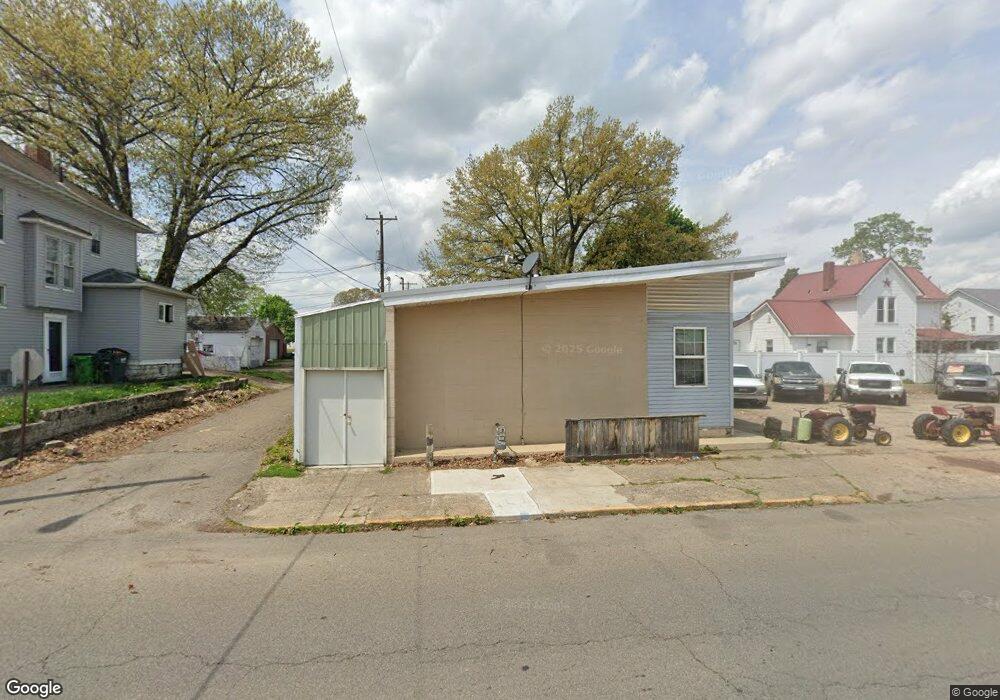
517 S 7th St Coshocton, OH 43812
Estimated Value: $87,156 - $130,000
2
Beds
1
Bath
1,176
Sq Ft
$94/Sq Ft
Est. Value
About This Home
This home is located at 517 S 7th St, Coshocton, OH 43812 and is currently estimated at $110,039, approximately $93 per square foot. 517 S 7th St is a home located in Coshocton County with nearby schools including Coshocton High School, Coshocton Opportunity School, and Sacred Heart Elementary School.
Ownership History
Date
Name
Owned For
Owner Type
Purchase Details
Closed on
Feb 22, 2018
Sold by
Craibo Properties Llc
Bought by
Klein Shane A
Current Estimated Value
Purchase Details
Closed on
May 11, 2012
Sold by
Murray Stanley C and Murray Lisa L
Bought by
Caribo Properties
Purchase Details
Closed on
Apr 2, 2003
Sold by
Wilfong James
Bought by
Murray Stanley C
Purchase Details
Closed on
Jan 6, 1997
Sold by
Kidwell Kevin B
Bought by
Wilfong James
Purchase Details
Closed on
Jan 15, 1992
Sold by
Kidwell Barbara L
Bought by
Kidwell Kevin B
Create a Home Valuation Report for This Property
The Home Valuation Report is an in-depth analysis detailing your home's value as well as a comparison with similar homes in the area
Home Values in the Area
Average Home Value in this Area
Purchase History
| Date | Buyer | Sale Price | Title Company |
|---|---|---|---|
| Klein Shane A | $45,000 | None Available | |
| Caribo Properties | $28,100 | None Available | |
| Murray Stanley C | $92,500 | -- | |
| Wilfong James | $36,000 | -- | |
| Kidwell Kevin B | -- | -- |
Source: Public Records
Tax History
| Year | Tax Paid | Tax Assessment Tax Assessment Total Assessment is a certain percentage of the fair market value that is determined by local assessors to be the total taxable value of land and additions on the property. | Land | Improvement |
|---|---|---|---|---|
| 2024 | $659 | $15,600 | $3,350 | $12,250 |
| 2023 | $659 | $13,710 | $2,573 | $11,137 |
| 2022 | $672 | $13,710 | $2,570 | $11,140 |
| 2021 | $673 | $13,710 | $2,573 | $11,137 |
| 2020 | $593 | $11,669 | $2,625 | $9,044 |
| 2019 | $606 | $11,669 | $2,625 | $9,044 |
| 2018 | $799 | $12,289 | $10,003 | $2,286 |
| 2017 | $793 | $12,289 | $10,003 | $2,286 |
| 2016 | $772 | $12,289 | $10,003 | $2,286 |
| 2015 | $384 | $12,289 | $10,003 | $2,286 |
| 2014 | $758 | $13,157 | $10,668 | $2,489 |
Source: Public Records
Map
Nearby Homes
Your Personal Tour Guide
Ask me questions while you tour the home.