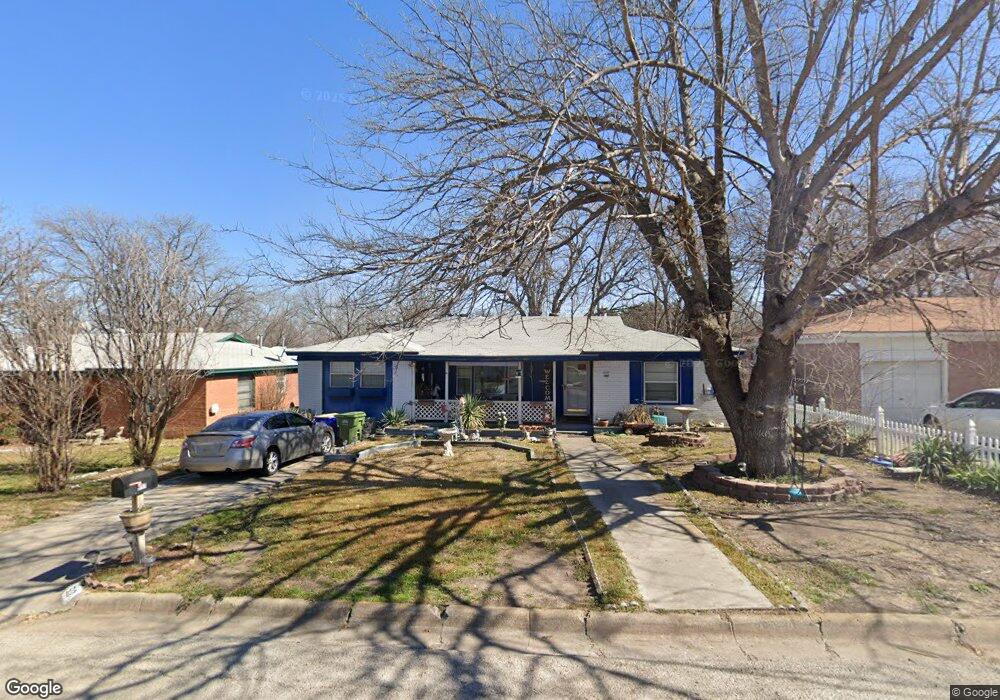
517 Sandell Dr Fort Worth, TX 76108
Estimated Value: $194,000 - $225,000
3
Beds
2
Baths
1,260
Sq Ft
$168/Sq Ft
Est. Value
About This Home
This home is located at 517 Sandell Dr, Fort Worth, TX 76108 and is currently estimated at $211,420, approximately $167 per square foot. 517 Sandell Dr is a home located in Tarrant County with nearby schools including Liberty Elementary School, Brewer Middle School, and Tannahill Intermediate School.
Ownership History
Date
Name
Owned For
Owner Type
Purchase Details
Closed on
Jun 22, 2024
Sold by
Roy Juanita
Bought by
Roy Arlene Kae
Current Estimated Value
Purchase Details
Closed on
Jun 6, 2024
Sold by
Roy Albert
Bought by
Roy Arlene Kae
Purchase Details
Closed on
Jun 5, 2024
Sold by
Roy Jacob
Bought by
Roy Arlene Kae
Purchase Details
Closed on
Jun 4, 2024
Sold by
Roy Tommie
Bought by
Roy Arlene Kae
Purchase Details
Closed on
May 23, 2024
Sold by
Roy Timothy Maurice and Roy Arlene Kae
Bought by
Kae Roy Arlene and Kae Juanita Roy
Purchase Details
Closed on
Oct 19, 2006
Sold by
Murphy Darla J
Bought by
Roy Timothy M
Home Financials for this Owner
Home Financials are based on the most recent Mortgage that was taken out on this home.
Original Mortgage
$81,600
Interest Rate
6.41%
Mortgage Type
Stand Alone First
Create a Home Valuation Report for This Property
The Home Valuation Report is an in-depth analysis detailing your home's value as well as a comparison with similar homes in the area
Home Values in the Area
Average Home Value in this Area
Purchase History
| Date | Buyer | Sale Price | Title Company |
|---|---|---|---|
| Roy Arlene Kae | -- | None Listed On Document | |
| Roy Arlene Kae | -- | None Listed On Document | |
| Roy Arlene Kae | -- | None Listed On Document | |
| Roy Arlene Kae | -- | None Listed On Document | |
| Roy Arlene Kae | -- | None Listed On Document | |
| Kae Roy Arlene | -- | None Listed On Document | |
| Roy Timothy M | -- | Fnt |
Source: Public Records
Mortgage History
| Date | Status | Borrower | Loan Amount |
|---|---|---|---|
| Previous Owner | Roy Timothy M | $81,600 |
Source: Public Records
Tax History Compared to Growth
Tax History
| Year | Tax Paid | Tax Assessment Tax Assessment Total Assessment is a certain percentage of the fair market value that is determined by local assessors to be the total taxable value of land and additions on the property. | Land | Improvement |
|---|---|---|---|---|
| 2025 | $4,670 | $197,110 | $37,800 | $159,310 |
| 2024 | $4,670 | $197,110 | $37,800 | $159,310 |
| 2023 | $4,943 | $207,896 | $37,800 | $170,096 |
| 2022 | $3,198 | $162,702 | $25,000 | $137,702 |
| 2021 | $2,953 | $148,215 | $25,000 | $123,215 |
| 2020 | $2,704 | $119,970 | $25,000 | $94,970 |
| 2019 | $2,552 | $117,215 | $25,000 | $92,215 |
| 2018 | $1,817 | $80,659 | $12,000 | $68,659 |
| 2017 | $2,143 | $81,804 | $12,000 | $69,804 |
| 2016 | $1,948 | $79,177 | $12,000 | $67,177 |
| 2015 | $1,426 | $60,600 | $10,000 | $50,600 |
| 2014 | $1,426 | $60,600 | $10,000 | $50,600 |
Source: Public Records
Map
Nearby Homes
- 537 June Dr
- 501 Odie Dr
- 321 Meadow Park Dr
- 633 Kimbrough St
- 8203 Delmar St
- 730 S Cherry Ln
- 8017 White Settlement Rd
- 149 Wilson Cliff Dr
- 8232 Redonda St
- 801 Ala Dr
- 8316 Sussex St
- 852 Odie Dr
- 301 Mirike Dr
- 867 Odie Dr
- 872 June Dr
- 7836 Corina Dr
- 200 Waynell St
- 9752 New Bern Dr
- 8113 Raymond Ave
- 7805 Whitney Dr
- 513 Sandell Dr
- 521 Sandell Dr
- 516 Crandle Dr
- 509 Sandell Dr
- 520 Crandle Dr
- 525 Sandell Dr
- 512 Crandle Dr
- 524 Crandle Dr
- 516 Sandell Dr
- 508 Crandle Dr
- 512 Sandell Dr
- 505 Sandell Dr
- 528 Crandle Dr
- 524 Sandell Dr
- 504 Crandle Dr
- 501 Sandell Dr
- 8008 Wyatt Dr
- 505 June Dr
- 3024 Dixondale Dr
- 3036 Dixondale Dr