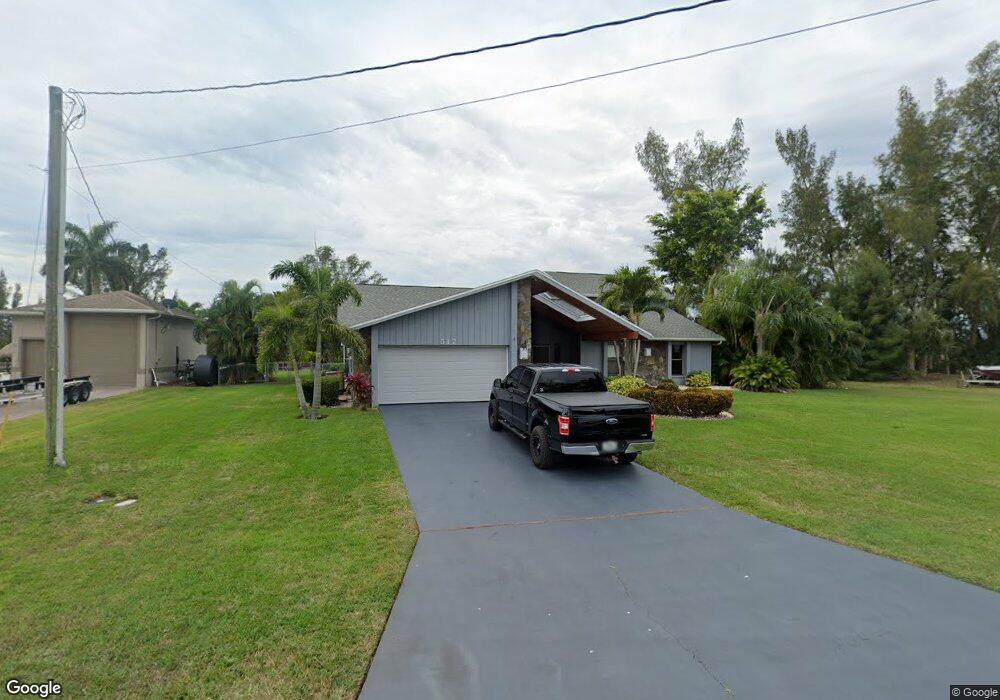
517 SW 9th St Cape Coral, FL 33991
Hancock NeighborhoodEstimated Value: $545,934 - $696,000
4
Beds
2
Baths
3,320
Sq Ft
$180/Sq Ft
Est. Value
About This Home
This home is located at 517 SW 9th St, Cape Coral, FL 33991 and is currently estimated at $597,734, approximately $180 per square foot. 517 SW 9th St is a home located in Lee County with nearby schools including Caloosa Elementary School, Tropic Isles Elementary School, and Hancock Creek Elementary School.
Ownership History
Date
Name
Owned For
Owner Type
Purchase Details
Closed on
Oct 18, 2023
Sold by
Stevens Vern and Stevens Candace
Bought by
Stevens Candace and Stevens Vern
Current Estimated Value
Purchase Details
Closed on
Apr 2, 2010
Sold by
Russell Michele L and Hardwick Michele L
Bought by
Stevens Vern and Stevens Candace
Purchase Details
Closed on
Jun 24, 2009
Sold by
Russell Bruce C
Bought by
Stevens Vern A and Stevens Candace B
Home Financials for this Owner
Home Financials are based on the most recent Mortgage that was taken out on this home.
Original Mortgage
$120,000
Interest Rate
5.04%
Mortgage Type
New Conventional
Purchase Details
Closed on
Aug 10, 1998
Sold by
Steinmann Edward and Steinmann Carol A
Bought by
Russell Bruce C
Home Financials for this Owner
Home Financials are based on the most recent Mortgage that was taken out on this home.
Original Mortgage
$141,150
Interest Rate
6.97%
Create a Home Valuation Report for This Property
The Home Valuation Report is an in-depth analysis detailing your home's value as well as a comparison with similar homes in the area
Home Values in the Area
Average Home Value in this Area
Purchase History
| Date | Buyer | Sale Price | Title Company |
|---|---|---|---|
| Stevens Candace | $100 | None Listed On Document | |
| Stevens Vern | $18,000 | Patriot Title Services Llc | |
| Stevens Vern A | $240,000 | Title Professionals Of Fl | |
| Russell Bruce C | $140,500 | -- |
Source: Public Records
Mortgage History
| Date | Status | Borrower | Loan Amount |
|---|---|---|---|
| Previous Owner | Stevens Vern A | $120,000 | |
| Previous Owner | Russell Bruce C | $141,150 |
Source: Public Records
Tax History Compared to Growth
Tax History
| Year | Tax Paid | Tax Assessment Tax Assessment Total Assessment is a certain percentage of the fair market value that is determined by local assessors to be the total taxable value of land and additions on the property. | Land | Improvement |
|---|---|---|---|---|
| 2025 | $4,812 | $213,068 | -- | -- |
| 2024 | $4,812 | $207,063 | -- | -- |
| 2023 | $4,689 | $201,032 | $0 | $0 |
| 2022 | $4,415 | $191,336 | $0 | $0 |
| 2021 | $4,472 | $326,535 | $81,325 | $245,210 |
| 2020 | $4,471 | $183,198 | $0 | $0 |
| 2019 | $4,311 | $179,079 | $0 | $0 |
| 2018 | $4,330 | $175,740 | $0 | $0 |
| 2017 | $4,261 | $169,578 | $0 | $0 |
| 2016 | $4,243 | $267,264 | $68,716 | $198,548 |
| 2015 | $4,244 | $245,197 | $61,358 | $183,839 |
| 2014 | -- | $206,495 | $57,551 | $148,944 |
| 2013 | -- | $202,465 | $42,700 | $159,765 |
Source: Public Records
Map
Nearby Homes
- 525 SW 8th Terrace
- 1006 SW 6th Ave
- 925 SW 6th Ct Unit 47
- 920 SW 4th Place
- 909 SW 6th Ct
- 1005 SW 6th Place
- 1109 SW 6th Ave
- 923 SW 4th Place
- 938 SW 6th Place
- 502 SW 7th Terrace
- 805 SW 6th Ct
- 1008 SW 4th Place
- 415 SW 7th Terrace
- 1013 SW 4th Place
- 614 SW 12th St
- 1011 SW 4th Ave
- 911 SW 3rd Ave
- 605 SW 13th St
- 225 SW 12th Terrace
- 837 SW 2nd Ave