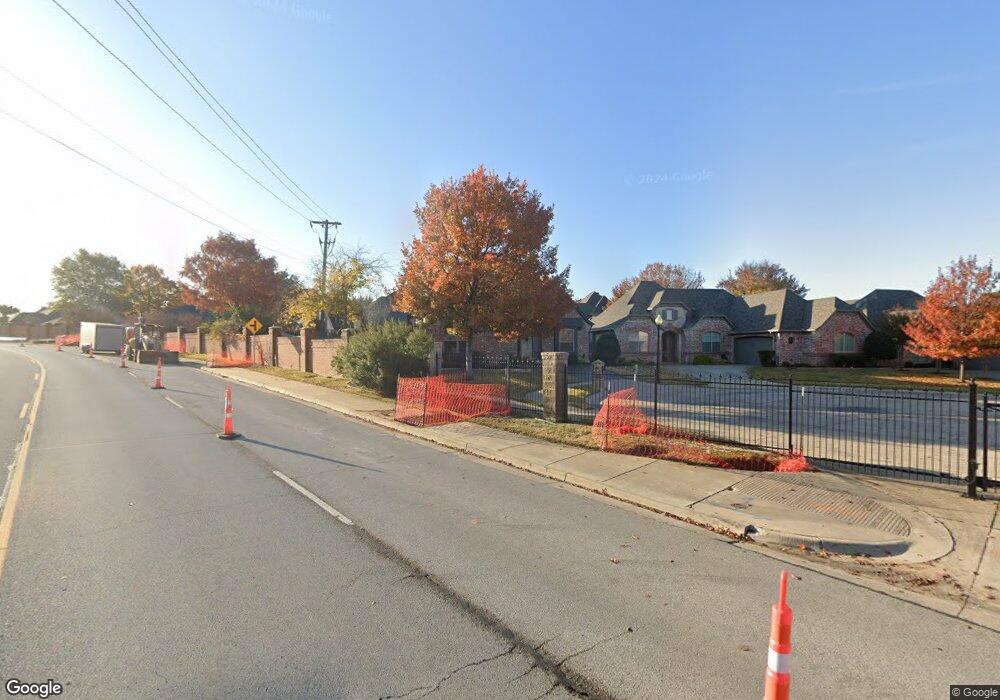
517 Waterford Ln Colleyville, TX 76034
Estimated Value: $619,000 - $774,000
3
Beds
2
Baths
2,419
Sq Ft
$281/Sq Ft
Est. Value
About This Home
This home is located at 517 Waterford Ln, Colleyville, TX 76034 and is currently estimated at $680,340, approximately $281 per square foot. 517 Waterford Ln is a home located in Tarrant County with nearby schools including Bransford Elementary School, Colleyville Middle School, and Grapevine High School.
Ownership History
Date
Name
Owned For
Owner Type
Purchase Details
Closed on
Jul 9, 2014
Sold by
Martin Kristine Ruth
Bought by
Martin Kevin L
Current Estimated Value
Purchase Details
Closed on
Feb 20, 2007
Sold by
Gary Panno Inc
Bought by
Martin Kevin and Martin Kristine
Home Financials for this Owner
Home Financials are based on the most recent Mortgage that was taken out on this home.
Original Mortgage
$254,000
Outstanding Balance
$152,220
Interest Rate
6.17%
Mortgage Type
Purchase Money Mortgage
Estimated Equity
$528,120
Purchase Details
Closed on
May 22, 2006
Sold by
First State Bank Of Gainesville
Bought by
Gary Panno Inc
Home Financials for this Owner
Home Financials are based on the most recent Mortgage that was taken out on this home.
Original Mortgage
$300,000
Interest Rate
6.56%
Mortgage Type
Purchase Money Mortgage
Create a Home Valuation Report for This Property
The Home Valuation Report is an in-depth analysis detailing your home's value as well as a comparison with similar homes in the area
Home Values in the Area
Average Home Value in this Area
Purchase History
| Date | Buyer | Sale Price | Title Company |
|---|---|---|---|
| Martin Kevin L | -- | None Available | |
| Martin Kevin | -- | None Available | |
| Gary Panno Inc | -- | None Available |
Source: Public Records
Mortgage History
| Date | Status | Borrower | Loan Amount |
|---|---|---|---|
| Open | Martin Kevin | $254,000 | |
| Previous Owner | Gary Panno Inc | $300,000 | |
| Closed | Martin Kevin L | $0 |
Source: Public Records
Tax History Compared to Growth
Tax History
| Year | Tax Paid | Tax Assessment Tax Assessment Total Assessment is a certain percentage of the fair market value that is determined by local assessors to be the total taxable value of land and additions on the property. | Land | Improvement |
|---|---|---|---|---|
| 2025 | $2,428 | $576,000 | $150,000 | $426,000 |
| 2024 | $2,428 | $648,701 | $150,000 | $498,701 |
| 2023 | $9,145 | $629,763 | $105,000 | $524,763 |
| 2022 | $9,734 | $513,151 | $105,000 | $408,151 |
| 2021 | $9,840 | $448,065 | $105,000 | $343,065 |
| 2020 | $9,992 | $449,664 | $105,000 | $344,664 |
| 2019 | $10,433 | $451,263 | $105,000 | $346,263 |
| 2018 | $2,629 | $442,149 | $105,000 | $337,149 |
| 2017 | $10,434 | $454,624 | $105,000 | $349,624 |
| 2016 | $9,485 | $422,868 | $105,000 | $317,868 |
| 2015 | $8,260 | $365,000 | $70,000 | $295,000 |
| 2014 | $8,260 | $365,000 | $70,000 | $295,000 |
Source: Public Records
Map
Nearby Homes
- 4600 Bransford Rd
- 628 Huntwich Dr
- 4105 Inwood Ln
- 909 Brestol Ct W
- 4600 Westbury Dr
- 405 Woodbriar Ct
- 4516 Dartmoore Ln
- 4002 Copperwood Ct
- 1921 Maplewood Trail
- 3605 Spring Valley Dr
- 3624 Wayne Ct
- 3907 Copperwood Ct
- 312 Bremen Dr
- 3609 Wayne Ct
- 114 Glade Rd
- 1104 Garry Lynne Dr
- 112 Glade Rd
- 405 Bremen Dr
- 3713 Brentwood Ct
- 2116 Cottage Oak Ln
- 513 Waterford Ln
- 512 Bridlewood N
- 600 Bridlewood N
- 600 Bridlewood N
- 505 Waterford Ln
- 504 Bridlewood N
- 516 Waterford Ln
- 4212 Green Meadow St W
- 4301 Tiffany Park Ln
- 4214 Green Meadow St W
- 501 Waterford Ln
- 4210 Green Meadow St W
- 500 Bridlewood N
- 604 Bridlewood N
- 4305 Tiffany Park Ln
- 4115 Coachman Ln
- 4216 Green Meadow St W
- 429 Waterford Ln
- 4309 Tiffany Park Ln
- 4114 Coachman Ln