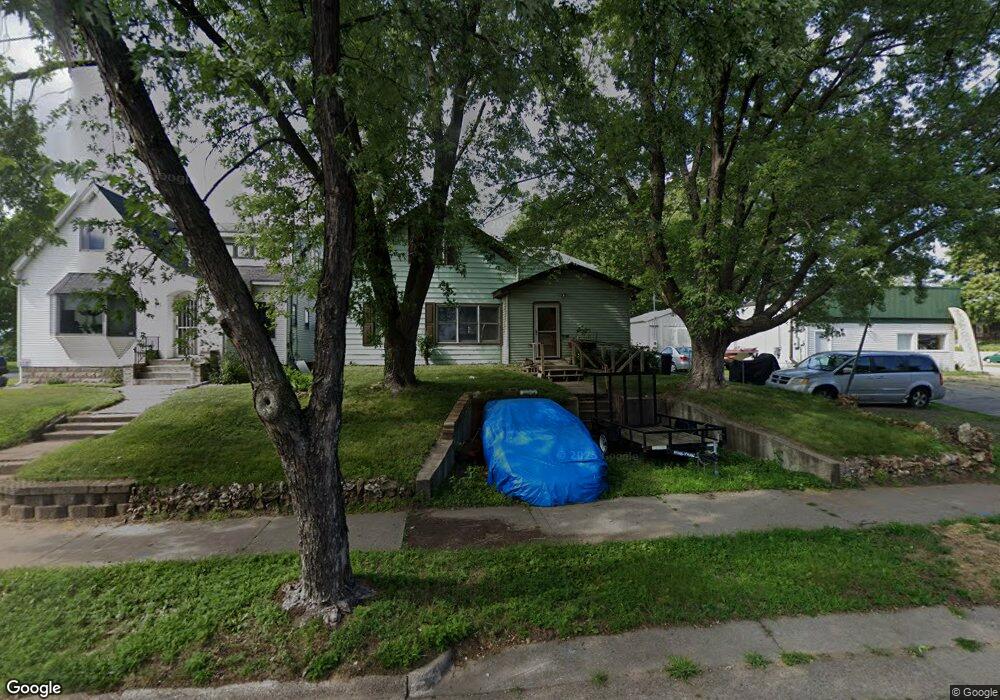
517 Windsor St La Crosse, WI 54603
Lower Northside NeighborhoodEstimated Value: $122,000 - $182,000
4
Beds
1
Bath
1,787
Sq Ft
$86/Sq Ft
Est. Value
About This Home
This home is located at 517 Windsor St, La Crosse, WI 54603 and is currently estimated at $152,961, approximately $85 per square foot. 517 Windsor St is a home located in La Crosse County with nearby schools including Northside Elementary School, Logan Middle School, and Logan High School.
Ownership History
Date
Name
Owned For
Owner Type
Purchase Details
Closed on
Oct 30, 2025
Sold by
Rosson Richard A
Bought by
Banicki Jesse J and Banicki Molly A
Current Estimated Value
Home Financials for this Owner
Home Financials are based on the most recent Mortgage that was taken out on this home.
Original Mortgage
$97,500
Outstanding Balance
$97,500
Interest Rate
6.26%
Mortgage Type
New Conventional
Estimated Equity
$55,461
Create a Home Valuation Report for This Property
The Home Valuation Report is an in-depth analysis detailing your home's value as well as a comparison with similar homes in the area
Home Values in the Area
Average Home Value in this Area
Purchase History
| Date | Buyer | Sale Price | Title Company |
|---|---|---|---|
| Banicki Jesse J | $10,000 | Town N Country Title |
Source: Public Records
Mortgage History
| Date | Status | Borrower | Loan Amount |
|---|---|---|---|
| Open | Banicki Jesse J | $97,500 |
Source: Public Records
Tax History
| Year | Tax Paid | Tax Assessment Tax Assessment Total Assessment is a certain percentage of the fair market value that is determined by local assessors to be the total taxable value of land and additions on the property. | Land | Improvement |
|---|---|---|---|---|
| 2024 | $2,580 | $125,500 | $12,100 | $113,400 |
| 2023 | $2,253 | $125,500 | $12,100 | $113,400 |
| 2022 | $2,177 | $125,500 | $12,100 | $113,400 |
| 2021 | $1,974 | $88,800 | $12,100 | $76,700 |
| 2020 | $2,029 | $88,800 | $12,100 | $76,700 |
| 2019 | $1,982 | $88,800 | $12,100 | $76,700 |
| 2018 | $1,440 | $58,600 | $9,700 | $48,900 |
| 2017 | $1,491 | $58,600 | $9,700 | $48,900 |
| 2016 | $1,705 | $58,600 | $9,700 | $48,900 |
| 2015 | $1,497 | $58,600 | $9,700 | $48,900 |
| 2014 | $1,484 | $58,600 | $9,700 | $48,900 |
| 2013 | $1,530 | $58,600 | $9,700 | $48,900 |
Source: Public Records
Map
Nearby Homes