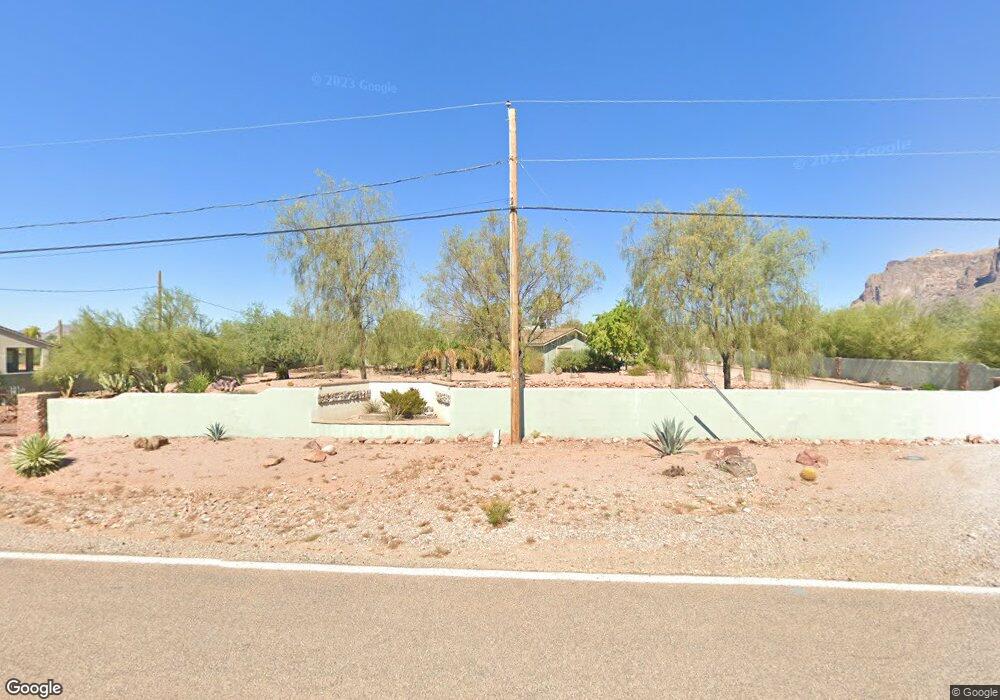
5170 E Junction St Apache Junction, AZ 85119
Estimated Value: $391,142 - $557,000
2
Beds
2
Baths
1,714
Sq Ft
$283/Sq Ft
Est. Value
About This Home
This home is located at 5170 E Junction St, Apache Junction, AZ 85119 and is currently estimated at $485,036, approximately $282 per square foot. 5170 E Junction St is a home located in Pinal County with nearby schools including Desert Vista Elementary School, Cactus Canyon Junior High School, and Apache Junction High School.
Ownership History
Date
Name
Owned For
Owner Type
Purchase Details
Closed on
Sep 15, 2021
Sold by
Boswell Marcella J and Boswell Marcella J
Bought by
Boswell Marcella J and Thomas Marcellas Children Dev
Current Estimated Value
Purchase Details
Closed on
Feb 25, 2011
Sold by
Boswell Marcella J and Boswell Larry E
Bought by
Boswell Larry E and Boswell Marclela J
Home Financials for this Owner
Home Financials are based on the most recent Mortgage that was taken out on this home.
Original Mortgage
$121,200
Interest Rate
4.75%
Mortgage Type
New Conventional
Purchase Details
Closed on
Jan 23, 2003
Sold by
Vanwert James and Vanwert Ellen
Bought by
Boswell Larry E and Thomas Marcella J
Home Financials for this Owner
Home Financials are based on the most recent Mortgage that was taken out on this home.
Original Mortgage
$135,000
Interest Rate
5.97%
Mortgage Type
New Conventional
Purchase Details
Closed on
Oct 21, 1996
Sold by
Landwehr Larry T and Landwehr Patti K
Bought by
Vanwert James and Vanwert Ellen
Create a Home Valuation Report for This Property
The Home Valuation Report is an in-depth analysis detailing your home's value as well as a comparison with similar homes in the area
Home Values in the Area
Average Home Value in this Area
Purchase History
| Date | Buyer | Sale Price | Title Company |
|---|---|---|---|
| Boswell Marcella J | -- | None Listed On Document | |
| Boswell Larry E | -- | Lsi Title | |
| Boswell Larry E | $145,000 | Chicago Title Insurance Co | |
| Vanwert James | $112,050 | First American Title |
Source: Public Records
Mortgage History
| Date | Status | Borrower | Loan Amount |
|---|---|---|---|
| Previous Owner | Boswell Larry E | $121,200 | |
| Previous Owner | Boswell Larry E | $135,000 |
Source: Public Records
Tax History
| Year | Tax Paid | Tax Assessment Tax Assessment Total Assessment is a certain percentage of the fair market value that is determined by local assessors to be the total taxable value of land and additions on the property. | Land | Improvement |
|---|---|---|---|---|
| 2025 | $1,320 | $33,795 | -- | -- |
| 2024 | $1,240 | $29,221 | -- | -- |
| 2023 | $1,299 | $26,598 | $11,663 | $14,935 |
| 2022 | $1,240 | $17,947 | $7,632 | $10,315 |
| 2021 | $1,280 | $17,136 | $0 | $0 |
| 2020 | $1,248 | $16,603 | $0 | $0 |
| 2019 | $1,194 | $15,885 | $0 | $0 |
| 2018 | $1,168 | $14,981 | $0 | $0 |
| 2017 | $1,139 | $13,778 | $0 | $0 |
| 2016 | $1,104 | $11,930 | $5,582 | $6,348 |
| 2014 | $1,060 | $6,948 | $3,500 | $3,448 |
Source: Public Records
Map
Nearby Homes
- 103 S Sixshooter Rd
- 463 N Mountain View Rd
- 619 N Sun Rd
- 562 N Sun Rd
- 5098 E 4th Ave
- 661 N Al Sieber Rd
- 442 N Mountain View Rd
- 5130 E Superstition Blvd
- 0 N Roadrunner Rd 1 Acre --
- 5660 E Calle Mirage
- 0000 S Roadrunner Rd Unit 1
- 0 S Roadrunner Rd Unit 3
- 0 S Roadrunner Rd Unit D
- 0000 S Roadrunner Rd Unit 2
- 0 S Roadrunner Rd Unit 6850461
- 945 N Mountain View Rd
- 4454 E Cody St
- 990 N Muleshoe Rd
- 5029 E Roundup St
- E W Broadway Ave
- 5144 E Junction St
- 5144 E Junction St
- 5144 E Junction St
- 0 W Val Vista -- Unit 5476118
- 0 W Val Vista -- Unit 5715382
- 0000 N Val Vista Rd Unit B
- 0000 N Val Vista Rd Unit D
- 00000000 N Val Vista Rd Unit B
- 0 N Val Vista Rd Unit 5510869
- 0 N Val Vista Rd Unit 5510895
- 5112 E Junction St
- 35 N Val Vista Rd
- 5123 E Junction St
- 5098 E Junction St
- 5179 E Roosevelt St
- 5117 E Junction St
- 125 N Val Vista Rd
- 0 S Sun Rd Unit LOT E 6329306
- 0 S Sun Rd Unit LOT C 6329190
- 0 S Sun Rd Unit LOT D 6269438
Your Personal Tour Guide
Ask me questions while you tour the home.