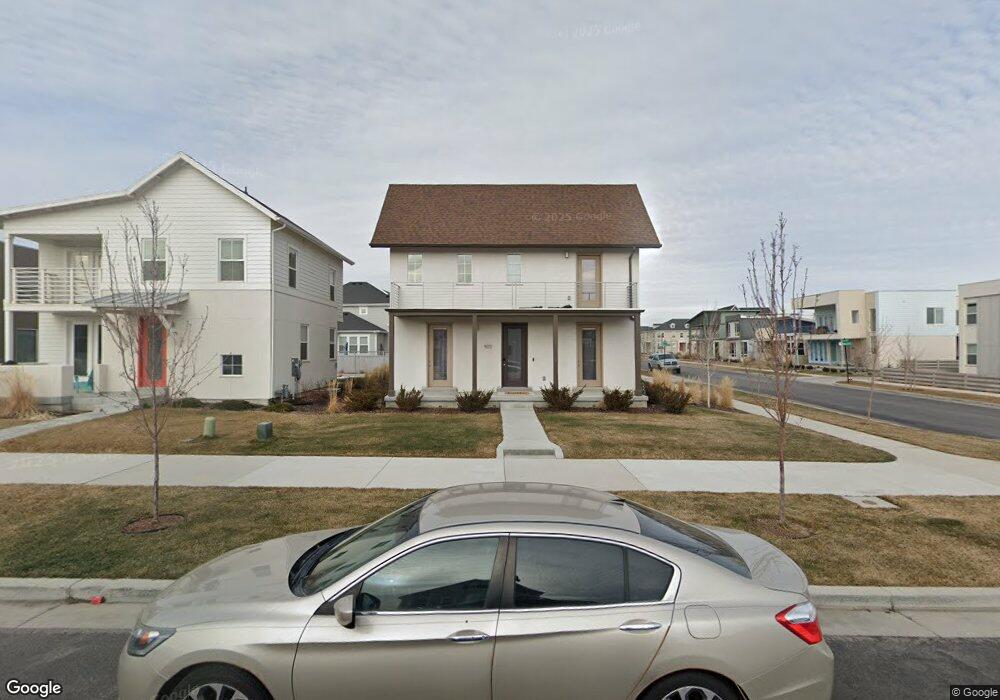
5172 W Dock St Unit 370 South Jordan, UT 84009
Daybreak NeighborhoodEstimated Value: $681,000 - $738,000
3
Beds
3
Baths
2,868
Sq Ft
$249/Sq Ft
Est. Value
About This Home
This home is located at 5172 W Dock St Unit 370, South Jordan, UT 84009 and is currently estimated at $713,269, approximately $248 per square foot. 5172 W Dock St Unit 370 is a home located in Salt Lake County with nearby schools including Golden Fields Elementary School, Mountain Creek Middle School, and Herriman High School.
Ownership History
Date
Name
Owned For
Owner Type
Purchase Details
Closed on
Jul 20, 2021
Sold by
Clark Jacqueline
Bought by
Deluna Beltre Juan M and Martinez Genesis A
Current Estimated Value
Home Financials for this Owner
Home Financials are based on the most recent Mortgage that was taken out on this home.
Original Mortgage
$500,000
Outstanding Balance
$454,088
Interest Rate
2.96%
Mortgage Type
New Conventional
Estimated Equity
$259,181
Purchase Details
Closed on
Jul 16, 2019
Sold by
Db Village 5 Inc
Bought by
Clark Jacqueline
Home Financials for this Owner
Home Financials are based on the most recent Mortgage that was taken out on this home.
Original Mortgage
$323,000
Interest Rate
3.82%
Mortgage Type
New Conventional
Purchase Details
Closed on
Mar 20, 2017
Sold by
Vp Daybreak Operations Llc
Bought by
Db Village 5 Inc
Create a Home Valuation Report for This Property
The Home Valuation Report is an in-depth analysis detailing your home's value as well as a comparison with similar homes in the area
Home Values in the Area
Average Home Value in this Area
Purchase History
| Date | Buyer | Sale Price | Title Company |
|---|---|---|---|
| Deluna Beltre Juan M | -- | Titan Title Ins Agcy Inc | |
| Clark Jacqueline | -- | Meridian Title | |
| Db Village 5 Inc | -- | First American Title |
Source: Public Records
Mortgage History
| Date | Status | Borrower | Loan Amount |
|---|---|---|---|
| Open | Deluna Beltre Juan M | $500,000 | |
| Previous Owner | Clark Jacqueline | $323,000 |
Source: Public Records
Tax History Compared to Growth
Tax History
| Year | Tax Paid | Tax Assessment Tax Assessment Total Assessment is a certain percentage of the fair market value that is determined by local assessors to be the total taxable value of land and additions on the property. | Land | Improvement |
|---|---|---|---|---|
| 2025 | $3,519 | $676,000 | $89,400 | $586,600 |
| 2024 | $3,519 | $668,100 | $86,800 | $581,300 |
| 2023 | $3,653 | $654,500 | $84,300 | $570,200 |
| 2022 | $3,754 | $659,100 | $82,600 | $576,500 |
| 2021 | $2,606 | $419,800 | $63,600 | $356,200 |
| 2020 | $2,508 | $378,800 | $60,000 | $318,800 |
| 2019 | $2,449 | $363,500 | $60,000 | $303,500 |
| 2018 | $736 | $59,800 | $59,800 | $0 |
| 2017 | $751 | $59,800 | $59,800 | $0 |
Source: Public Records
Map
Nearby Homes
- 10572 S Kestrel Rise Rd
- 5248 W South Jordan Pkwy
- 5262 S Jordan Pkwy W
- 5291 W Big Sur Dr
- 10606 S Redknife Dr
- 669 Split Rock Dr Unit 115
- 5261 W Bowstring Way
- 5239 W Bowstring Way Unit 518
- 5131 W Split Rock Dr
- 11381 S Watercourse Rd Unit 205
- 5371 W Bowstring Way
- 4966 W Kitsap Way Unit 10-532
- 10617 S Split Rock Dr
- 5131 W Mellow Way
- 10804 S Gresham Dr
- 10421 S Split Rock Dr
- 5023 S Jordan Pkwy W
- 10904 S Gresham Dr
- 5206 W Mellow Way
- 5191 W Mellow Way
- 5172 W Dock St
- 5178 W Dock St Unit 369
- 5178 W Dock St
- 5182 W Dock St Unit 368
- 10654 S Skamania Ln
- 5158 W Dock St
- 5158 W Dock St Unit 382
- 10658 S Skamania Ln
- 5188 W Dock St
- 5167 W Dock St
- 5154 W Dock St Unit 383
- 10644 S Skamania Ln
- 10643 S Skamania Ln
- 5171 W Dock St
- 10652 S Skamania Ln
- 5157 W Dock St Unit 394
- 5194 W Dock St
- 10673 S Lamond Dr
- 10641 S Skamania Ln Unit 380
- 10641 S Skamania Ln