Estimated Value: $417,402 - $457,000
3
Beds
3
Baths
1,550
Sq Ft
$277/Sq Ft
Est. Value
About This Home
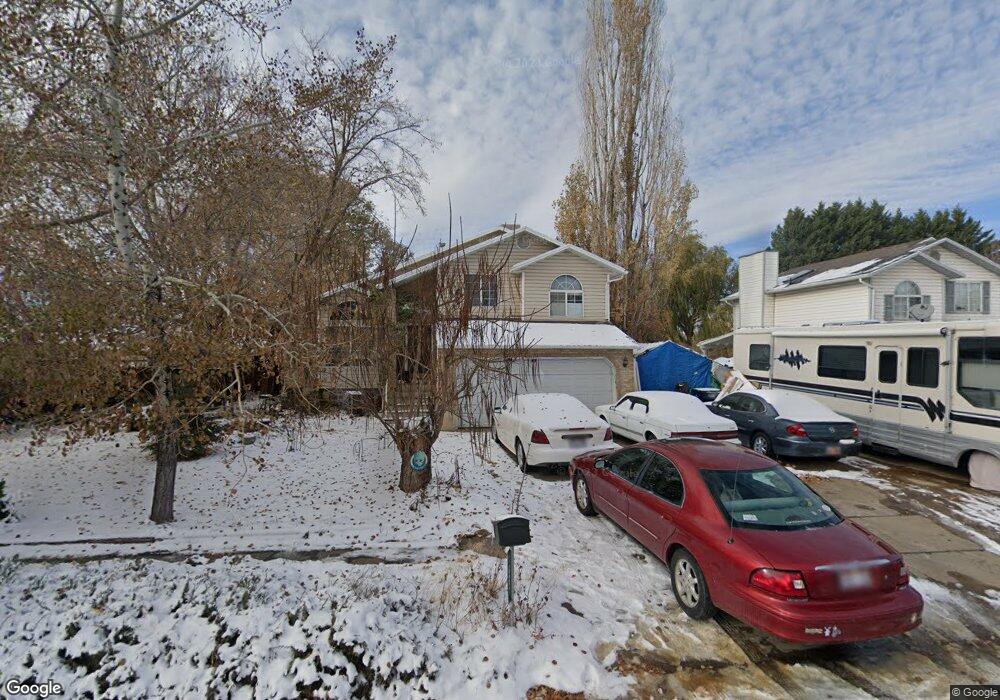
This home is located at 5173 S 3025 W, Roy, UT 84067 and is currently estimated at $428,851, approximately $276 per square foot. 5173 S 3025 W is a home located in Weber County with nearby schools including Midland School, Sand Ridge Junior High School, and Roy High School.
Ownership History
Date
Name
Owned For
Owner Type
Purchase Details
Closed on
Jul 1, 2004
Sold by
Hud
Bought by
Fuit Kenny J and Fuit Dawn
Current Estimated Value
Home Financials for this Owner
Home Financials are based on the most recent Mortgage that was taken out on this home.
Original Mortgage
$121,910
Outstanding Balance
$61,103
Interest Rate
6.27%
Mortgage Type
FHA
Estimated Equity
$367,748
Purchase Details
Closed on
Mar 29, 2004
Sold by
Mortgage Electronic Registration Systems
Bought by
Hud
Purchase Details
Closed on
Jan 16, 2004
Sold by
Thompson Brett L and Steele Stacy
Bought by
Mortgage Electronic Registration Systems
Purchase Details
Closed on
Oct 22, 1997
Sold by
Price William R and Price Jennie
Bought by
Thompson Brett L and Steele Stacy
Home Financials for this Owner
Home Financials are based on the most recent Mortgage that was taken out on this home.
Original Mortgage
$129,141
Interest Rate
7.49%
Mortgage Type
FHA
Create a Home Valuation Report for This Property
The Home Valuation Report is an in-depth analysis detailing your home's value as well as a comparison with similar homes in the area
Home Values in the Area
Average Home Value in this Area
Purchase History
| Date | Buyer | Sale Price | Title Company |
|---|---|---|---|
| Fuit Kenny J | -- | Monument Title Insurance Inc | |
| Hud | -- | First Southwestern Title | |
| Mortgage Electronic Registration Systems | $155,905 | First Southwestern Title | |
| Thompson Brett L | -- | Security Title |
Source: Public Records
Mortgage History
| Date | Status | Borrower | Loan Amount |
|---|---|---|---|
| Open | Fuit Kenny J | $121,910 | |
| Previous Owner | Thompson Brett L | $129,141 |
Source: Public Records
Tax History
| Year | Tax Paid | Tax Assessment Tax Assessment Total Assessment is a certain percentage of the fair market value that is determined by local assessors to be the total taxable value of land and additions on the property. | Land | Improvement |
|---|---|---|---|---|
| 2025 | $2,586 | $408,292 | $139,948 | $268,344 |
| 2024 | $2,483 | $216,699 | $76,971 | $139,728 |
| 2023 | $2,398 | $209,550 | $68,295 | $141,255 |
| 2022 | $2,651 | $240,900 | $58,259 | $182,641 |
| 2021 | $2,095 | $311,000 | $79,391 | $231,609 |
| 2020 | $1,986 | $271,000 | $79,391 | $191,609 |
| 2019 | $1,888 | $242,000 | $48,726 | $193,274 |
| 2018 | $1,771 | $213,000 | $48,726 | $164,274 |
| 2017 | $1,623 | $182,000 | $48,726 | $133,274 |
| 2016 | $1,607 | $97,262 | $23,294 | $73,968 |
| 2015 | $1,448 | $89,152 | $23,294 | $65,858 |
| 2014 | $1,412 | $85,778 | $23,294 | $62,484 |
Source: Public Records
Map
Nearby Homes
- 5141 S 2975 W
- 5155 S 3200 W
- 5321 S 3100 W
- 5009 S 2925 W
- 5063 S 2825 W
- 4891 S 2875 W
- 5421 S 2775 W
- 5529 S 3200 W
- 3443 W 5200 S Unit 2&3
- 4793 S 3025 W
- 3166 W 5625 S
- 3022 W 4750 S
- 3176 W 5625 S
- 5622 S 2950 W
- 5125 S 2600 W
- 2568 W 5225 S
- 2953 W 4650 S
- 3509 W 4835 S Unit 26
- 3517 W 4835 S Unit 27
- 2963 W 5750 S
Your Personal Tour Guide
Ask me questions while you tour the home.