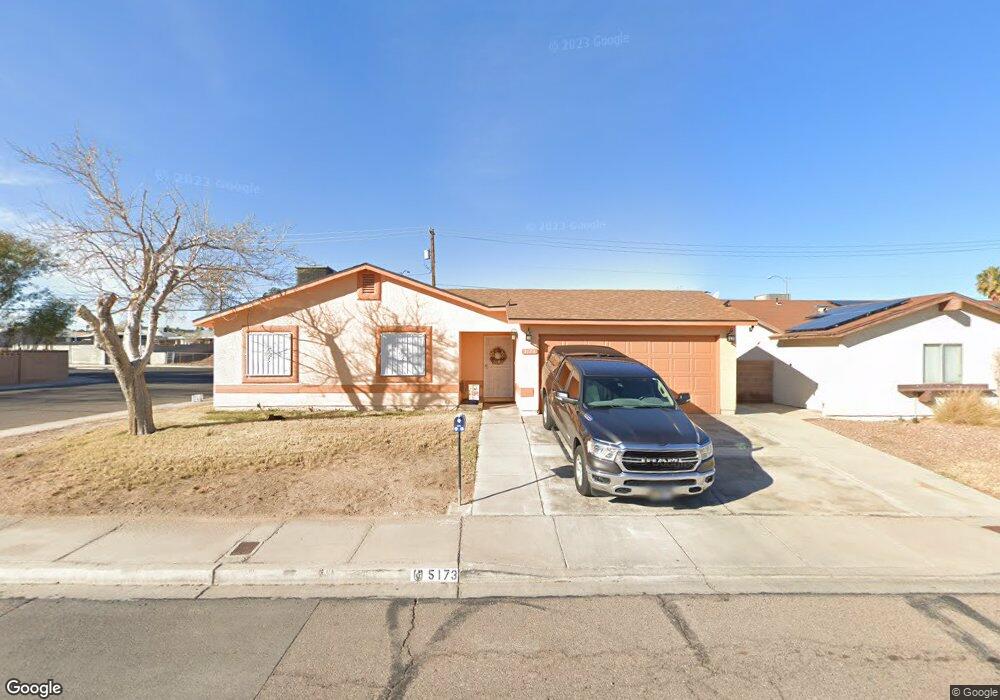
5173 Timberwood St Las Vegas, NV 89122
Estimated Value: $403,000 - $487,000
4
Beds
3
Baths
1,810
Sq Ft
$238/Sq Ft
Est. Value
About This Home
This home is located at 5173 Timberwood St, Las Vegas, NV 89122 and is currently estimated at $430,633, approximately $237 per square foot. 5173 Timberwood St is a home located in Clark County with nearby schools including Harley Harmon Elementary School, Francis H Cortney Junior High School, and Del Sol Academy of the Performing Arts.
Create a Home Valuation Report for This Property
The Home Valuation Report is an in-depth analysis detailing your home's value as well as a comparison with similar homes in the area
Home Values in the Area
Average Home Value in this Area
Tax History Compared to Growth
Tax History
| Year | Tax Paid | Tax Assessment Tax Assessment Total Assessment is a certain percentage of the fair market value that is determined by local assessors to be the total taxable value of land and additions on the property. | Land | Improvement |
|---|---|---|---|---|
| 2025 | $1,172 | $68,332 | $23,100 | $45,232 |
| 2024 | $1,139 | $68,332 | $23,100 | $45,232 |
| 2023 | $1,139 | $69,983 | $26,250 | $43,733 |
| 2022 | $1,106 | $62,320 | $22,050 | $40,270 |
| 2021 | $1,073 | $59,644 | $21,000 | $38,644 |
| 2020 | $1,039 | $56,446 | $17,850 | $38,596 |
| 2019 | $1,027 | $55,858 | $17,500 | $38,358 |
| 2018 | $980 | $51,681 | $14,700 | $36,981 |
| 2017 | $1,514 | $51,637 | $14,000 | $37,637 |
| 2016 | $918 | $45,770 | $7,350 | $38,420 |
| 2015 | $915 | $30,270 | $7,350 | $22,920 |
| 2014 | $888 | $30,255 | $5,250 | $25,005 |
Source: Public Records
Map
Nearby Homes
- 5030 E Hacienda Ave
- 5155 Saratoga Dr
- 5022 Carmel Ave Unit 3
- 4999 Nellis Cir
- 5225 Saratoga Dr
- 5068 Killarney St
- 5122 Gregg Place
- 5284 Wellesley Ave
- 5289 Chattanooga Ave
- 4805 Terra Linda Ave
- 5251 Tipper Ave
- 5359 Chattanooga Ave
- 4945 Rita Dr
- 4944 Rita Dr
- 4676 Tamalpias Ave
- 4674 Petaluma Cir
- 4715 Mill Valley Dr
- 5063 Blanton Dr
- 5086 Mountain Vista St
- 5078 Mountain Vista St
- 5167 Timberwood St Unit 2
- 5161 Timberwood St
- 5161 Timberwood St
- 5161 Timberwood St
- 5185 Timberwood St
- 5035 Laurelwood Ave
- 5145 Timberwood St
- 5036 Myrtlewood Ave
- 5191 Timberwood St
- 4987 Silverado Dr
- 5034 Laurelwood Ave
- 4987 Saratoga Cir
- 4987 Saratoga Cir
- 4987 Saratoga Cir
- 4987 Saratoga Cir
- 4987 Saratoga Cir
- 5045 Laurelwood Ave
- 4980 Saratoga Cir
- 5135 Timberwood St
- 5046 Myrtlewood Ave