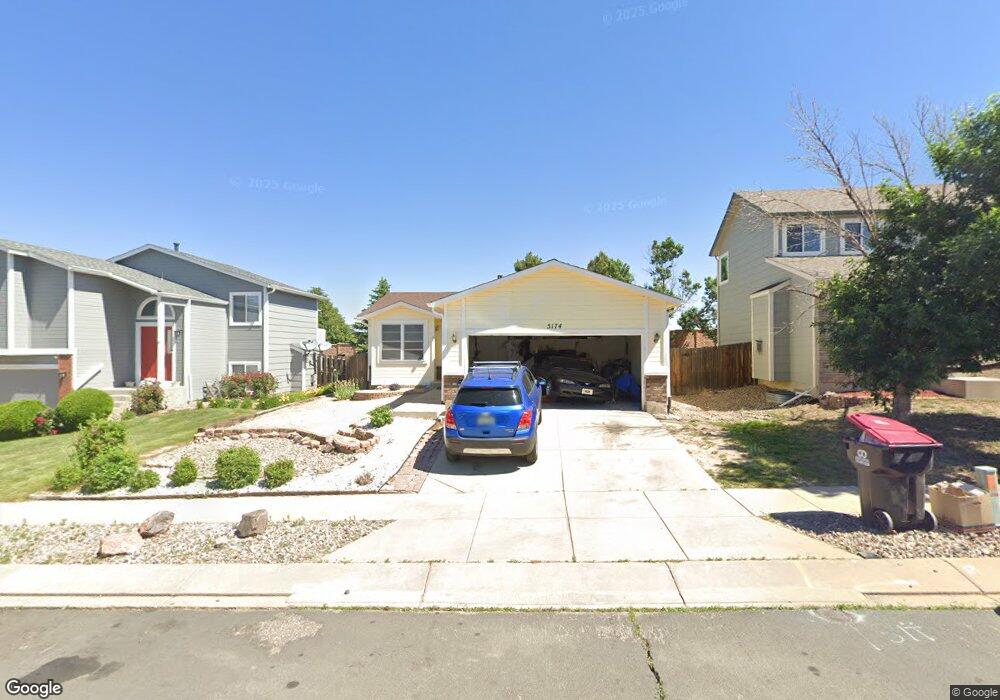
5174 Chaise Dr Colorado Springs, CO 80923
Wagon Trails NeighborhoodEstimated Value: $389,104 - $453,000
4
Beds
2
Baths
850
Sq Ft
$489/Sq Ft
Est. Value
About This Home
This home is located at 5174 Chaise Dr, Colorado Springs, CO 80923 and is currently estimated at $415,776, approximately $489 per square foot. 5174 Chaise Dr is a home located in El Paso County with nearby schools including Freedom Elementary School, Jenkins Middle School, and Doherty High School.
Ownership History
Date
Name
Owned For
Owner Type
Purchase Details
Closed on
Aug 26, 2015
Sold by
Kinkaid James J and Kinkaid Sharon K
Bought by
Kinkaid James John and Kinkaid Sharon Sanders
Current Estimated Value
Home Financials for this Owner
Home Financials are based on the most recent Mortgage that was taken out on this home.
Original Mortgage
$231,764
Outstanding Balance
$180,411
Interest Rate
4.12%
Mortgage Type
VA
Estimated Equity
$235,365
Purchase Details
Closed on
Jul 30, 2008
Sold by
Jones Karen L and Chapman Shirley E
Bought by
Kinkaid James J and Kinkaid Sharon K
Home Financials for this Owner
Home Financials are based on the most recent Mortgage that was taken out on this home.
Original Mortgage
$199,885
Interest Rate
6.4%
Mortgage Type
VA
Purchase Details
Closed on
Nov 22, 2000
Sold by
Hallmark Building Company Ltd I
Bought by
Jones Karen L and Chapman Shirley E
Home Financials for this Owner
Home Financials are based on the most recent Mortgage that was taken out on this home.
Original Mortgage
$125,948
Interest Rate
7.84%
Create a Home Valuation Report for This Property
The Home Valuation Report is an in-depth analysis detailing your home's value as well as a comparison with similar homes in the area
Home Values in the Area
Average Home Value in this Area
Purchase History
| Date | Buyer | Sale Price | Title Company |
|---|---|---|---|
| Kinkaid James John | -- | Title365 | |
| Kinkaid James J | $193,500 | Stewart Title | |
| Jones Karen L | $148,200 | Stewart Title |
Source: Public Records
Mortgage History
| Date | Status | Borrower | Loan Amount |
|---|---|---|---|
| Open | Kinkaid James John | $231,764 | |
| Closed | Kinkaid James J | $199,885 | |
| Previous Owner | Jones Karen L | $125,948 |
Source: Public Records
Tax History Compared to Growth
Tax History
| Year | Tax Paid | Tax Assessment Tax Assessment Total Assessment is a certain percentage of the fair market value that is determined by local assessors to be the total taxable value of land and additions on the property. | Land | Improvement |
|---|---|---|---|---|
| 2025 | $1,457 | $28,510 | -- | -- |
| 2024 | $1,344 | $28,850 | $5,310 | $23,540 |
| 2023 | $1,344 | $28,850 | $5,310 | $23,540 |
| 2022 | $1,242 | $20,740 | $4,400 | $16,340 |
| 2021 | $1,343 | $21,340 | $4,530 | $16,810 |
| 2020 | $1,228 | $17,100 | $3,930 | $13,170 |
| 2019 | $1,222 | $17,100 | $3,930 | $13,170 |
| 2018 | $1,166 | $15,080 | $3,170 | $11,910 |
| 2017 | $1,107 | $15,080 | $3,170 | $11,910 |
| 2016 | $924 | $14,930 | $3,330 | $11,600 |
| 2015 | $921 | $14,930 | $3,330 | $11,600 |
| 2014 | $870 | $13,570 | $3,330 | $10,240 |
Source: Public Records
Map
Nearby Homes
- 7259 Mineral Wells Dr
- 5095 Chaise Dr
- 7212 Duryea Dr
- 6942 Grand Prairie Dr
- 5540 Prairie Schooner Dr
- 4926 Chariot Dr
- 7137 Grand Prairie Dr
- 5536 Pioneer Mesa Dr
- 7169 Grand Prairie Dr
- 5579 Spoked Wheel Dr
- 7163 Sand Crest View
- 7775 Manston Dr
- 5387 Spoked Wheel Dr
- 7691 Scarborough Dr
- 7590 Chancellor Dr
- 4902 Cherry Springs Dr
- 5384 Oak Spring Heights
- 5253 Pine Haven Dr
- 5468 Oak Spring Heights
- 4721 Rowell Point
- 5168 Chaise Dr
- 5180 Chaise Dr
- 5162 Chaise Dr
- 5186 Chaise Dr
- 5156 Chaise Dr
- 5173 Chaise Dr
- 5185 Chaise Dr
- 5192 Chaise Dr
- 5155 Chaise Dr
- 5150 Chaise Dr
- 5197 Chaise Dr
- 5149 Chaise Dr
- 5198 Chaise Dr
- 5143 Chaise Dr
- 5411 Butterfield Dr
- 5399 Butterfield Dr
- 5204 Chaise Dr
- 5423 Butterfield Dr
- 5209 Chaise Dr
- 5387 Butterfield Dr