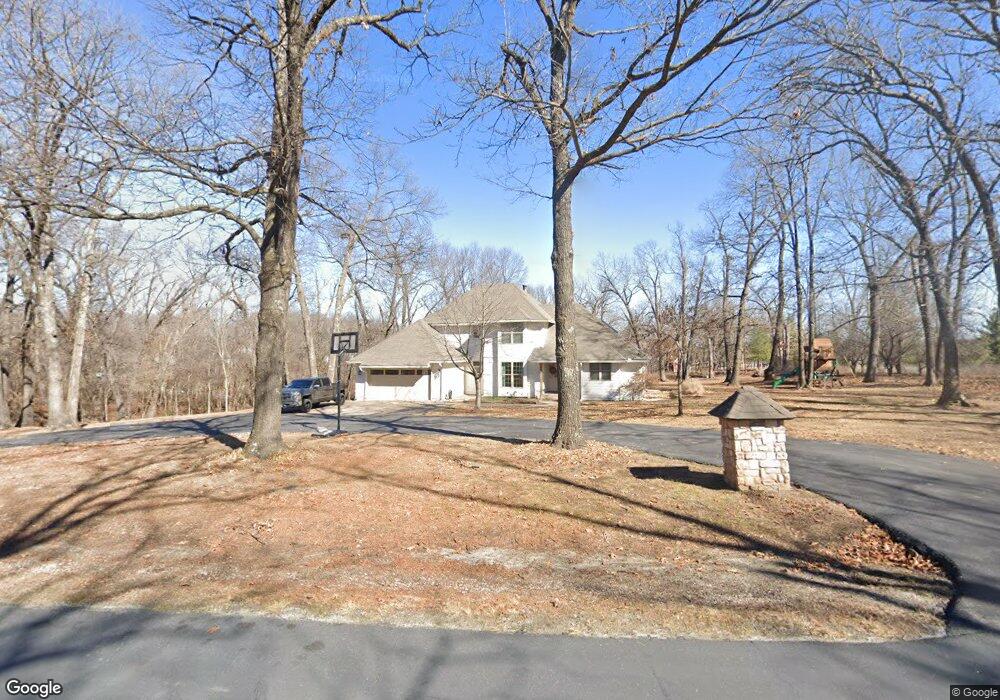
5174 Deer Run Loop Carthage, MO 64836
Estimated Value: $475,000 - $514,000
4
Beds
3
Baths
3,035
Sq Ft
$164/Sq Ft
Est. Value
About This Home
This home is located at 5174 Deer Run Loop, Carthage, MO 64836 and is currently estimated at $497,466, approximately $163 per square foot. 5174 Deer Run Loop is a home located in Jasper County with nearby schools including Carthage High School.
Ownership History
Date
Name
Owned For
Owner Type
Purchase Details
Closed on
Sep 22, 2025
Sold by
Martin John R and Martin Natalie M
Bought by
Martin Family Trust and Martin
Current Estimated Value
Purchase Details
Closed on
Dec 13, 2021
Sold by
Anton Frederick John and Anton Karla S
Bought by
Martin John R and Martin Natalie
Home Financials for this Owner
Home Financials are based on the most recent Mortgage that was taken out on this home.
Original Mortgage
$290,000
Interest Rate
3.14%
Mortgage Type
New Conventional
Purchase Details
Closed on
Dec 7, 2012
Sold by
Lesley Greg P and Lesley Taunya L
Bought by
Frederick John Anton and Frederick Karla S
Home Financials for this Owner
Home Financials are based on the most recent Mortgage that was taken out on this home.
Original Mortgage
$245,160
Interest Rate
3.42%
Mortgage Type
VA
Purchase Details
Closed on
Nov 8, 2011
Sold by
Wells Fargo Bank Na
Bought by
Lesley Greg P and Lesley Taunya L
Purchase Details
Closed on
Apr 5, 2011
Sold by
Mohle Frederick and Hytnen Laverne F
Bought by
Wells Fargo Bank Na
Create a Home Valuation Report for This Property
The Home Valuation Report is an in-depth analysis detailing your home's value as well as a comparison with similar homes in the area
Purchase History
| Date | Buyer | Sale Price | Title Company |
|---|---|---|---|
| Martin Family Trust | -- | None Listed On Document | |
| Martin John R | $385,700 | None Listed On Document | |
| Frederick John Anton | -- | None Available | |
| Lesley Greg P | $150,000 | Service Link | |
| Wells Fargo Bank Na | $198,500 | Jct |
Source: Public Records
Mortgage History
| Date | Status | Borrower | Loan Amount |
|---|---|---|---|
| Previous Owner | Martin John R | $290,000 | |
| Previous Owner | Frederick John Anton | $245,160 |
Source: Public Records
Tax History
| Year | Tax Paid | Tax Assessment Tax Assessment Total Assessment is a certain percentage of the fair market value that is determined by local assessors to be the total taxable value of land and additions on the property. | Land | Improvement |
|---|---|---|---|---|
| 2025 | $2,292 | $53,200 | $12,540 | $40,660 |
| 2024 | $2,292 | $48,990 | $12,540 | $36,450 |
| 2023 | $2,292 | $48,990 | $12,540 | $36,450 |
| 2022 | $2,306 | $49,470 | $12,540 | $36,930 |
| 2021 | $2,278 | $49,470 | $12,540 | $36,930 |
| 2020 | $2,186 | $45,600 | $12,540 | $33,060 |
| 2019 | $2,190 | $45,600 | $12,540 | $33,060 |
| 2018 | $2,008 | $41,850 | $0 | $0 |
| 2017 | $2,013 | $41,850 | $0 | $0 |
| 2016 | $2,065 | $43,070 | $0 | $0 |
Source: Public Records
Map
Nearby Homes
- 5137 Deer Run Loop
- 5042 Deer Run Loop
- 4955 Deer Run Loop
- 4948 Deer Run Loop
- 5000 & 4850 Chapel Rd
- 5000 S Chapel Rd
- 13813 Cimarron Rd
- 5115 S County Lane 162
- 12929 Cimarron Rd
- 3631 S Oak Hill Rd
- 10+/- S Oak Hill Chapel Tract 1
- 10+/- Acre S Oak Hill Chapel Tract 1
- 10+/- Acre S
- 20+/- S Oak Hill Chapel
- 20+/- S Oak Hill Chapel Tract D
- 10+/- S Oak Hill Chapel Tract 2
- 2000 Lakeview St
- TBD Corner of S Chapel & S Oak Hil Rd
- Tbd Corner of S Chapel &S Oak Hill
- Xxx Doctor Russell Smith Way
- 5191 Deer Run Loop
- 5110 Deer Run Loop
- 5068 Deer Run Loop
- 951 W 52nd St
- 5062 Deer Run Loop
- 4730 Deer Run Loop
- 5093 Deer Run Loop
- 5041 Deer Run Loop
- 855 W 52nd St
- 4755 Deer Run Loop
- 4740 Deer Run Loop
- 5016 Deer Run Loop
- 830 W 52nd St
- 5013 Deer Run Loop
- 4744 Deer Run Loop
- 705 W 52nd St
- 4991 Deer Run Loop
- 4964 Deer Run Loop
- 4787 Deer Run Loop
- 4810 Deer Run Loop
Your Personal Tour Guide
Ask me questions while you tour the home.