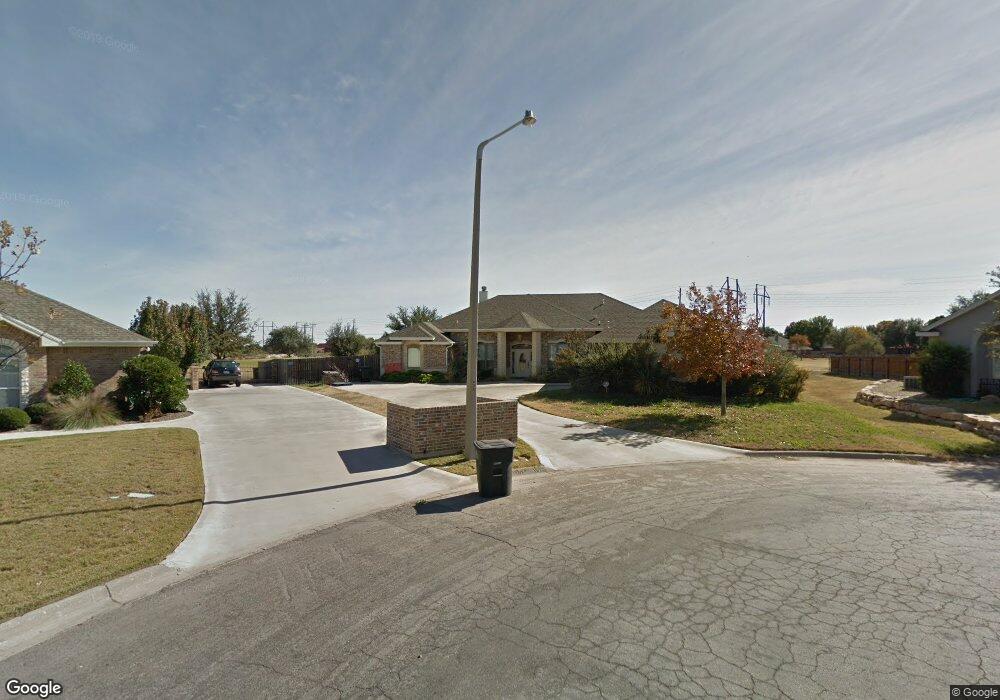
5174 Ironwood Ct San Angelo, TX 76904
Bentwood Country Club Estates NeighborhoodEstimated Value: $554,000 - $601,000
4
Beds
3
Baths
2,733
Sq Ft
$211/Sq Ft
Est. Value
About This Home
This home is located at 5174 Ironwood Ct, San Angelo, TX 76904 and is currently estimated at $576,266, approximately $210 per square foot. 5174 Ironwood Ct is a home located in Tom Green County with nearby schools including Lamar Elementary School, Glenn Middle School, and Central High School.
Ownership History
Date
Name
Owned For
Owner Type
Purchase Details
Closed on
Aug 12, 2009
Sold by
Klepach Neil A and Klepach Lisa E
Bought by
Conway Warren L
Current Estimated Value
Purchase Details
Closed on
Oct 24, 2006
Sold by
Klepach Neil A and Klepach Lisa E
Bought by
Conway Warren L
Purchase Details
Closed on
Aug 21, 2006
Sold by
Daga Properties Inc
Bought by
Klepach Neil A and Klepach Lisa E
Home Financials for this Owner
Home Financials are based on the most recent Mortgage that was taken out on this home.
Original Mortgage
$32,000
Interest Rate
6.79%
Mortgage Type
Stand Alone Second
Purchase Details
Closed on
May 25, 2004
Sold by
Shamrock Services Inc
Bought by
Conway Warren L
Purchase Details
Closed on
Aug 2, 1994
Sold by
Shamrock Services Inc
Bought by
Conway Warren L
Create a Home Valuation Report for This Property
The Home Valuation Report is an in-depth analysis detailing your home's value as well as a comparison with similar homes in the area
Home Values in the Area
Average Home Value in this Area
Purchase History
| Date | Buyer | Sale Price | Title Company |
|---|---|---|---|
| Conway Warren L | -- | -- | |
| Conway Warren L | -- | -- | |
| Klepach Neil A | -- | None Available | |
| Conway Warren L | -- | -- | |
| Conway Warren L | -- | -- |
Source: Public Records
Mortgage History
| Date | Status | Borrower | Loan Amount |
|---|---|---|---|
| Previous Owner | Klepach Neil A | $32,000 | |
| Previous Owner | Klepach Neil A | $256,000 |
Source: Public Records
Tax History Compared to Growth
Tax History
| Year | Tax Paid | Tax Assessment Tax Assessment Total Assessment is a certain percentage of the fair market value that is determined by local assessors to be the total taxable value of land and additions on the property. | Land | Improvement |
|---|---|---|---|---|
| 2025 | $8,379 | $587,530 | $89,790 | $497,740 |
| 2024 | $7,357 | $586,260 | $81,630 | $504,630 |
| 2023 | $6,614 | $602,470 | $97,840 | $504,630 |
| 2022 | $8,529 | $488,980 | $61,270 | $427,710 |
| 2021 | $8,484 | $349,920 | $0 | $0 |
| 2020 | $8,598 | $349,920 | $61,270 | $288,650 |
| 2019 | $8,856 | $349,920 | $61,270 | $288,650 |
| 2018 | $8,605 | $341,350 | $61,270 | $280,080 |
| 2017 | $8,490 | $338,430 | $61,270 | $277,160 |
| 2016 | $8,490 | $338,430 | $61,270 | $277,160 |
| 2015 | $7,839 | $359,610 | $39,500 | $320,110 |
| 2014 | $7,692 | $357,830 | $39,500 | $318,330 |
| 2013 | $6,976 | $311,400 | $0 | $0 |
Source: Public Records
Map
Nearby Homes
- 5202 Beverly Dr
- 5410 Lake Trail Ct
- 5214 N Bentwood Dr
- 5109 Beverly Dr
- 5241 Westway Dr
- 2118 Valleyview Dr
- 5234 Beverly Dr
- 4809 N Bentwood Dr
- 5121 Fairway Dr
- 5313 Enclave Ct
- 5104 Westway Dr
- 5417 Bent Oak Ct
- 2033 Silver Creek Ct
- 4745 Karsten Creek Dr
- 4998 Silver Creek Pass
- 2030 Silver Creek Ct
- TBD Knickerbocker Rd
- 2022 Silver Creek Ct
- 5425 Riviera Ln
- 4710 Shadow Creek Dr
- 5178 Ironwood Ct
- 5170 Ironwood Ct
- 5166 Ironwood Ct
- 5162 Ironwood Ct
- 5182 Ironwood Ct
- 5146 Bent Grass Ct
- 5146 Bent Grass Ct Unit 8
- 4544 N Bentwood Dr
- 5150 Bent Grass Ct
- 5163 Beverly Dr
- 5187 Beverly Dr
- 5159 Beverly Dr
- 4905 N Bentwood Dr
- 5138 Bent Grass Ct
- 5134 Bent Grass Ct
- 5205 N Bentwood Dr
- 5155 Beverly Dr
- 4901 N Bentwood Dr Unit 2
- 5402 Lake Trail Ct
- 5151 Beverly Dr