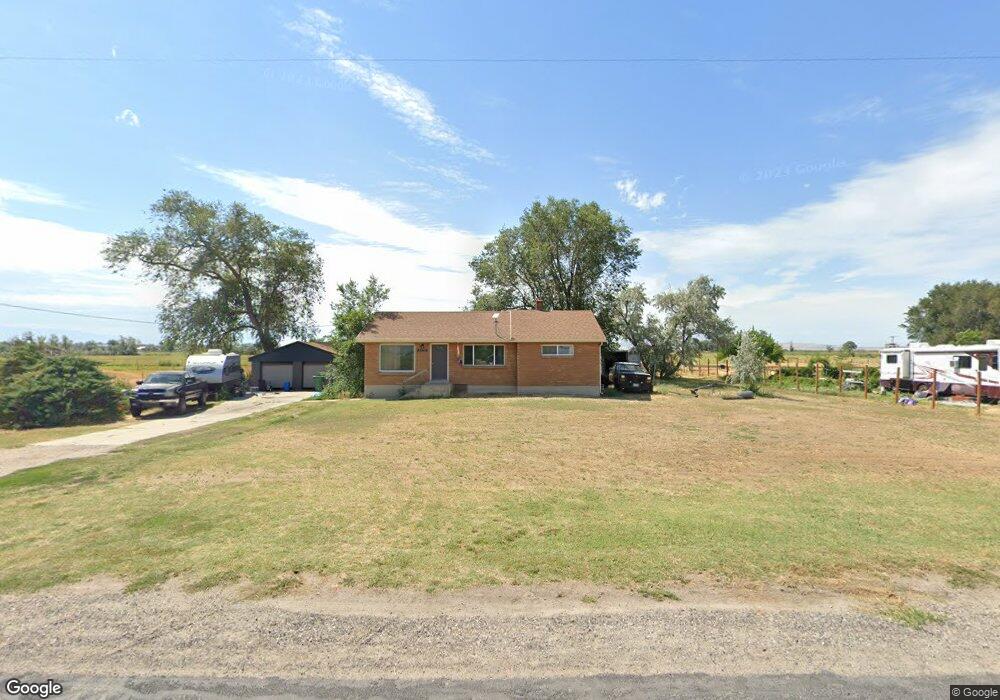
5175 W 1925 N Hooper, UT 84315
Estimated Value: $414,000 - $559,819
2
Beds
1
Bath
1,915
Sq Ft
$246/Sq Ft
Est. Value
About This Home
This home is located at 5175 W 1925 N, Hooper, UT 84315 and is currently estimated at $471,455, approximately $246 per square foot. 5175 W 1925 N is a home located in Davis County with nearby schools including West Point School, West Point Junior High School, and Syracuse High School.
Ownership History
Date
Name
Owned For
Owner Type
Purchase Details
Closed on
Oct 16, 2020
Sold by
Epps Brady J
Bought by
Epps Brady Jay and Stein Jamie Kelly
Current Estimated Value
Home Financials for this Owner
Home Financials are based on the most recent Mortgage that was taken out on this home.
Original Mortgage
$201,000
Outstanding Balance
$143,121
Interest Rate
2.8%
Mortgage Type
New Conventional
Estimated Equity
$328,334
Purchase Details
Closed on
Nov 16, 2011
Sold by
Stokes Scott Alfred
Bought by
Epps Brady J
Purchase Details
Closed on
Jul 20, 2011
Sold by
Wells Fargo Bank N A
Bought by
Stokes Scott Alfred
Purchase Details
Closed on
Mar 8, 2011
Sold by
Frew James Scott and Frew Princess B
Bought by
Wells Fargo Bank N A
Purchase Details
Closed on
Aug 29, 2006
Sold by
Gill Aaron
Bought by
Frew James Scott and Frew Princess B
Create a Home Valuation Report for This Property
The Home Valuation Report is an in-depth analysis detailing your home's value as well as a comparison with similar homes in the area
Home Values in the Area
Average Home Value in this Area
Purchase History
| Date | Buyer | Sale Price | Title Company |
|---|---|---|---|
| Epps Brady Jay | -- | First American Title | |
| Epps Brady J | -- | Lincoln Title Insuran | |
| Stokes Scott Alfred | -- | Home Abst & Title Co | |
| Wells Fargo Bank N A | $136,127 | Etitle Insurance Agency | |
| Frew James Scott | -- | Heritage West Title Ins Agen | |
| Gill Aaron | -- | Accommodation |
Source: Public Records
Mortgage History
| Date | Status | Borrower | Loan Amount |
|---|---|---|---|
| Open | Epps Brady Jay | $201,000 |
Source: Public Records
Tax History Compared to Growth
Tax History
| Year | Tax Paid | Tax Assessment Tax Assessment Total Assessment is a certain percentage of the fair market value that is determined by local assessors to be the total taxable value of land and additions on the property. | Land | Improvement |
|---|---|---|---|---|
| 2025 | $2,543 | $299,000 | $266,389 | $32,611 |
| 2024 | $2,543 | $293,925 | $235,900 | $58,025 |
| 2023 | $2,414 | $446,000 | $284,753 | $161,247 |
| 2022 | $2,558 | $258,500 | $157,034 | $101,466 |
| 2021 | $2,313 | $353,000 | $210,087 | $142,913 |
| 2020 | $2,092 | $308,000 | $177,609 | $130,391 |
| 2019 | $2,066 | $288,000 | $178,483 | $109,517 |
| 2018 | $1,735 | $244,000 | $160,878 | $83,122 |
| 2016 | $1,444 | $119,006 | $74,688 | $44,318 |
| 2015 | $1,381 | $108,171 | $74,688 | $33,483 |
| 2014 | $1,170 | $93,408 | $71,408 | $22,000 |
| 2013 | -- | $97,255 | $61,129 | $36,126 |
Source: Public Records
Map
Nearby Homes
- 1635 N 4625 W
- 2084 N 4500 W
- 2276 N 4500 W
- 5752 W 2425 N
- 1717 N 4325 W
- 4171 W 2425 N
- 4061 W 1250 N Unit 1250
- 1124 N 4150 W
- 4719 W 650 N
- 4469 W 1000 N Unit 120
- 3784 W 2300 N
- 2462 N Hooded Crane Ct
- 3762 W 2300 N
- 0 W 5500 S
- 477 N 4500 W
- 2400 Farmhouse Plan at Cranefield Estates - Estates Collection
- 2050 Craftsman Plan at Cranefield Estates - Estates Collection
- 2500 Traditional Plan at Cranefield Estates - Estates Collection
- Torino Farmhouse Plan at Cranefield Estates
- 2000 Farmhouse Plan at Cranefield Estates - Estates Collection