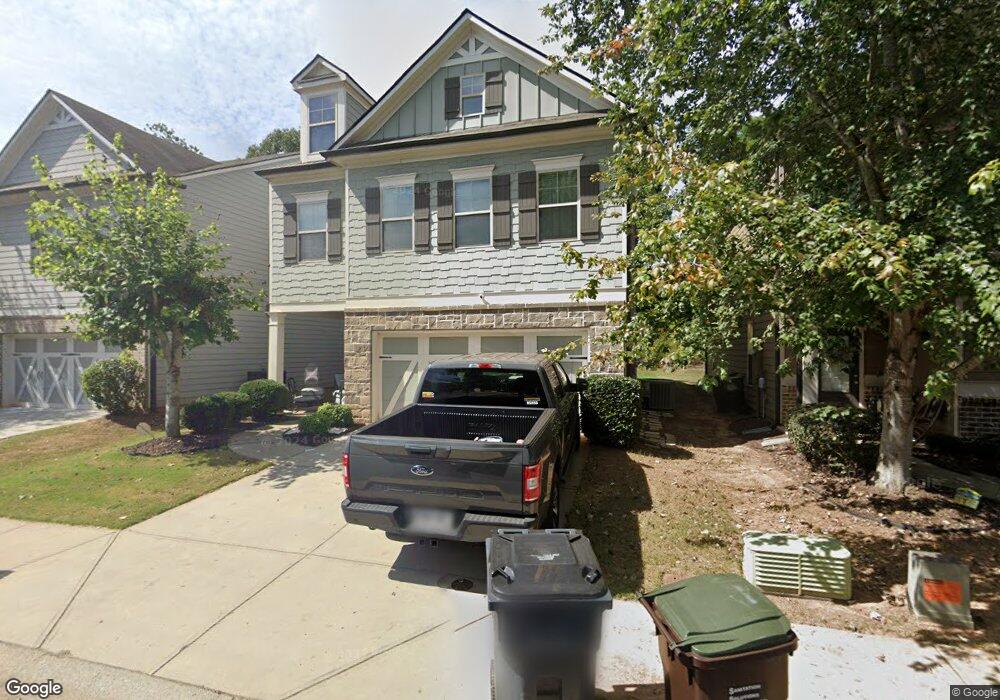
5176 Apple Grove Rd NE Buford, GA 30519
Estimated Value: $392,000 - $422,000
3
Beds
3
Baths
2,333
Sq Ft
$174/Sq Ft
Est. Value
About This Home
This home is located at 5176 Apple Grove Rd NE, Buford, GA 30519 and is currently estimated at $407,105, approximately $174 per square foot. 5176 Apple Grove Rd NE is a home located in Gwinnett County with nearby schools including Duncan Creek Elementary School, Frank N. Osborne Middle School, and Mill Creek High School.
Ownership History
Date
Name
Owned For
Owner Type
Purchase Details
Closed on
Sep 23, 2019
Sold by
Figueroa Mauricio A
Bought by
Parra Bracho Frank Albert and Rojas Carmen Cecillia
Current Estimated Value
Home Financials for this Owner
Home Financials are based on the most recent Mortgage that was taken out on this home.
Original Mortgage
$249,300
Outstanding Balance
$221,688
Interest Rate
4.37%
Mortgage Type
FHA
Estimated Equity
$185,417
Purchase Details
Closed on
May 15, 2015
Sold by
Willow Leaf Builders Llc
Bought by
Figueroa Mauricio A
Home Financials for this Owner
Home Financials are based on the most recent Mortgage that was taken out on this home.
Original Mortgage
$202,051
Interest Rate
3.75%
Mortgage Type
FHA
Purchase Details
Closed on
Dec 19, 2014
Sold by
Bcr Investments Llc
Bought by
Willow Leaf Builders Llc
Purchase Details
Closed on
Sep 9, 2013
Sold by
Fairway Fund Vii Llc
Bought by
Bcr Investments Llc
Create a Home Valuation Report for This Property
The Home Valuation Report is an in-depth analysis detailing your home's value as well as a comparison with similar homes in the area
Home Values in the Area
Average Home Value in this Area
Purchase History
| Date | Buyer | Sale Price | Title Company |
|---|---|---|---|
| Parra Bracho Frank Albert | $253,900 | -- | |
| Figueroa Mauricio A | $205,779 | -- | |
| Willow Leaf Builders Llc | $200,000 | -- | |
| Bcr Investments Llc | $3,340,000 | -- |
Source: Public Records
Mortgage History
| Date | Status | Borrower | Loan Amount |
|---|---|---|---|
| Open | Parra Bracho Frank Albert | $249,300 | |
| Previous Owner | Figueroa Mauricio A | $202,051 |
Source: Public Records
Tax History Compared to Growth
Tax History
| Year | Tax Paid | Tax Assessment Tax Assessment Total Assessment is a certain percentage of the fair market value that is determined by local assessors to be the total taxable value of land and additions on the property. | Land | Improvement |
|---|---|---|---|---|
| 2024 | $6,165 | $165,080 | $33,200 | $131,880 |
| 2023 | $6,165 | $173,000 | $33,200 | $139,800 |
| 2022 | $5,515 | $147,640 | $30,800 | $116,840 |
| 2021 | $4,064 | $105,000 | $21,120 | $83,880 |
| 2020 | $3,794 | $96,920 | $19,600 | $77,320 |
| 2019 | $3,228 | $96,920 | $19,600 | $77,320 |
| 2018 | $3,052 | $88,720 | $16,800 | $71,920 |
| 2016 | $2,837 | $80,360 | $14,000 | $66,360 |
| 2015 | $579 | $9,720 | $9,720 | $0 |
| 2014 | -- | $7,520 | $7,520 | $0 |
Source: Public Records
Map
Nearby Homes
- 2070 Cabela Dr
- 2046 Barberry Dr
- 5711 Apple Grove Rd
- 6071 Apple Grove Rd
- 5125 Cactus Cove Ln
- 6096 Apple Grove Rd
- 5586 Apple Grove Rd
- 4979 Lily Stem Dr
- 4909 Lily Stem Dr
- 4849 Lily Stem Dr
- 4642 Devencrest Ln Unit 1
- 2152 Andrewood Place
- 4693 Devencrest Ln
- 2234 Grape Vine Way
- 4881 Bill Cheek Rd
- 2264 Oak Falls Ln
- Taylorsville Plan at Vines at Mill Creek - Estate Series
- Gibson Basement Plan at Vines at Mill Creek - Estate Series
- Gibson Plan at Vines at Mill Creek - Estate Series
- 5176 Apple Grove Rd
- 5166 Apple Grove Rd
- 5186 Apple Grove Rd
- 5196 Apple Grove Rd NE
- 5156 Apple Grove Rd
- 5196 Apple Grove Rd
- 5146 Apple Grove Rd
- 5146 Apple Grove Rd
- 5206 Apple Grove Rd
- 5181 Apple Grove Rd
- 5181 Apple Grove Rd NE
- 5151 Apple Grove Rd NE
- 5136 Apple Grove Rd NE
- 5191 Apple Grove Rd
- 5191 Apple Grove Rd Unit 2
- 2120 Cabela Dr
- 5216 Apple Grove Rd
- 5136 Apple Grove Rd Unit 5136
- 5136 Apple Grove Rd
- 5141 Apple Grove Rd Unit C3