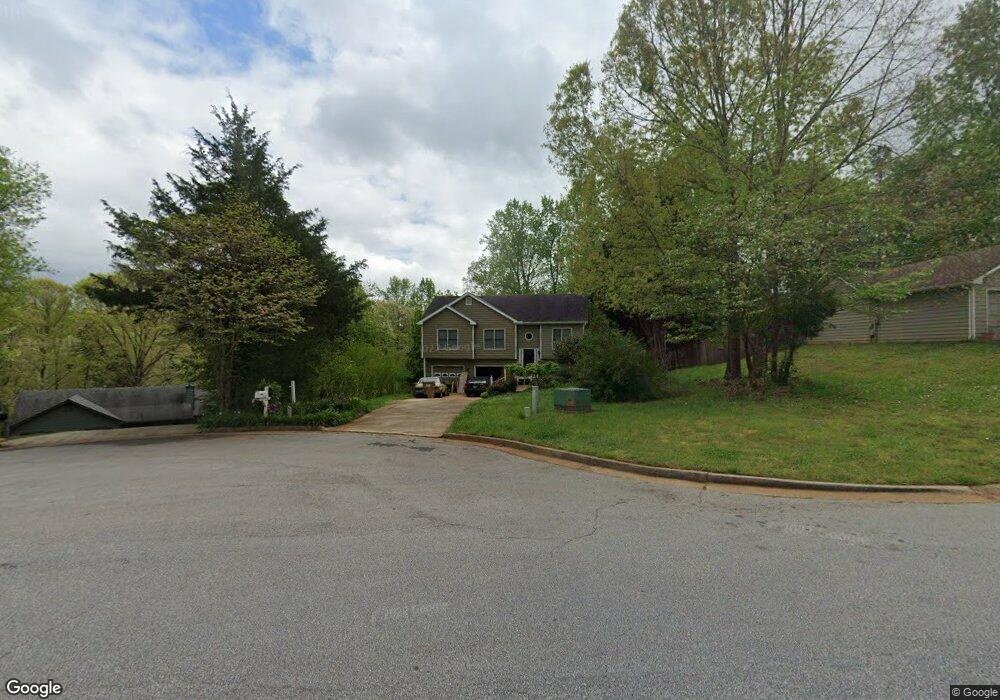
5176 Sable Ct Flowery Branch, GA 30542
Estimated Value: $303,000 - $353,000
3
Beds
2
Baths
1,213
Sq Ft
$264/Sq Ft
Est. Value
About This Home
This home is located at 5176 Sable Ct, Flowery Branch, GA 30542 and is currently estimated at $320,177, approximately $263 per square foot. 5176 Sable Ct is a home located in Hall County with nearby schools including Chestnut Mountain Elementary School, Cherokee Bluff Middle School, and Cherokee Bluff High School.
Ownership History
Date
Name
Owned For
Owner Type
Purchase Details
Closed on
Sep 25, 2017
Sold by
Comeaux Charity L
Bought by
Comeaux Randy
Current Estimated Value
Home Financials for this Owner
Home Financials are based on the most recent Mortgage that was taken out on this home.
Original Mortgage
$135,616
Outstanding Balance
$113,429
Interest Rate
3.87%
Mortgage Type
FHA
Estimated Equity
$206,748
Purchase Details
Closed on
Sep 25, 2006
Sold by
Comeaux Randy Lynn
Bought by
Comeaux Randy Lynn and Comeaux Charity L
Home Financials for this Owner
Home Financials are based on the most recent Mortgage that was taken out on this home.
Original Mortgage
$115,360
Interest Rate
6.46%
Mortgage Type
New Conventional
Purchase Details
Closed on
Jan 11, 1999
Sold by
Henderson Jeff
Bought by
Curry Scott and Curry Amanda
Home Financials for this Owner
Home Financials are based on the most recent Mortgage that was taken out on this home.
Original Mortgage
$99,850
Interest Rate
6.72%
Mortgage Type
FHA
Create a Home Valuation Report for This Property
The Home Valuation Report is an in-depth analysis detailing your home's value as well as a comparison with similar homes in the area
Home Values in the Area
Average Home Value in this Area
Purchase History
| Date | Buyer | Sale Price | Title Company |
|---|---|---|---|
| Comeaux Randy | -- | -- | |
| Comeaux Randy Lynn | -- | -- | |
| Comeaux Randy Lynn | $144,200 | -- | |
| Curry Scott | $100,700 | -- |
Source: Public Records
Mortgage History
| Date | Status | Borrower | Loan Amount |
|---|---|---|---|
| Open | Comeaux Randy | $135,616 | |
| Previous Owner | Comeaux Randy Lynn | $115,360 | |
| Previous Owner | Comeaux Randy Lynn | $28,840 | |
| Previous Owner | Curry Scott | $99,850 |
Source: Public Records
Tax History Compared to Growth
Tax History
| Year | Tax Paid | Tax Assessment Tax Assessment Total Assessment is a certain percentage of the fair market value that is determined by local assessors to be the total taxable value of land and additions on the property. | Land | Improvement |
|---|---|---|---|---|
| 2024 | $2,509 | $99,440 | $10,680 | $88,760 |
| 2023 | $2,139 | $100,240 | $10,680 | $89,560 |
| 2022 | $1,850 | $69,840 | $10,680 | $59,160 |
| 2021 | $1,919 | $71,200 | $10,680 | $60,520 |
| 2020 | $1,899 | $68,520 | $10,680 | $57,840 |
| 2019 | $1,556 | $55,320 | $6,400 | $48,920 |
| 2018 | $1,399 | $48,040 | $6,400 | $41,640 |
| 2017 | $1,324 | $45,840 | $6,400 | $39,440 |
| 2016 | $1,099 | $38,680 | $6,400 | $32,280 |
| 2015 | $711 | $24,252 | $3,520 | $20,732 |
| 2014 | $711 | $24,252 | $3,520 | $20,732 |
Source: Public Records
Map
Nearby Homes
- 5432 Aurora Trail Unit LOT 70
- 5428 Aurora Trail
- 5428 Aurora Trail Unit LOT 71
- 5427 Aurora Trail Unit LOT 65
- 5436 Aurora Trail
- 5416 Aurora Trail Unit LOT 74
- 5412 Aurora Trail Unit LOT 75
- 5427 Aurora Trail
- 5435 Aurora Trail
- 5432 Aurora Trail
- 5412 Aurora Trail
- 5424 Aurora Trail Unit LOT 72
- 5431 Aurora Trail
- 5416 Aurora Trail
- 5435 Aurora Trail Unit LOT 67
- 5431 Aurora Trail Unit LOT 66
- 5436 Aurora Trail Unit LOT 69
- 5424 Aurora Trail
- 5126 Cash Rd
- 5273 Mulberry Creek Way
- 5180 Sable Ct
- 5172 Sable Ct
- 5179 Sagewood Dr
- 5183 Sagewood Dr
- 5171 Sable Ct
- 5184 Sable Ct
- 5184 Sable Ct Unit 5184
- 5177 Sable Ct
- 5174 Sagewood Dr
- 5178 Sagewood Dr
- 5187 Sagewood Dr
- 5175 Sable Ct
- 0 Sable Ct Unit 7166455
- 0 Sable Ct Unit 7000411
- 0 Sable Ct Unit 3248077
- 0 Sable Ct
- 5170 Sagewood Dr
- 5182 Sagewood Dr
- 0 Sagewood Dr Unit 7405140
- 0 Sagewood Dr Unit 7390970