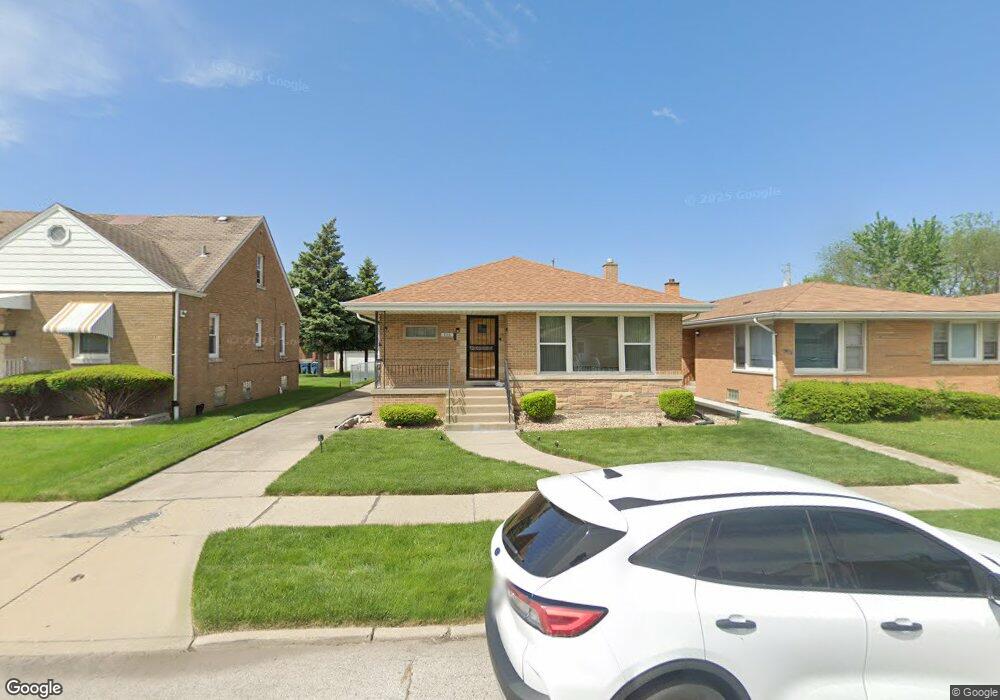
518 157th St Calumet City, IL 60409
Estimated Value: $180,000 - $210,000
3
Beds
1
Bath
1,432
Sq Ft
$133/Sq Ft
Est. Value
About This Home
This home is located at 518 157th St, Calumet City, IL 60409 and is currently estimated at $190,467, approximately $133 per square foot. 518 157th St is a home located in Cook County with nearby schools including Lincoln Elementary School, Thornton Fractional North High School, and Hammond Academy Of Science & Tech.
Ownership History
Date
Name
Owned For
Owner Type
Purchase Details
Closed on
Jun 28, 2021
Sold by
Hornestar Bank And Financial Services
Bought by
Smith Terrill L
Current Estimated Value
Home Financials for this Owner
Home Financials are based on the most recent Mortgage that was taken out on this home.
Original Mortgage
$118,000
Interest Rate
6.32%
Mortgage Type
New Conventional
Purchase Details
Closed on
Jul 2, 2019
Sold by
Smith Terrill L
Bought by
Homestar Bk & Fincl Svcs and Trust Number 1827
Create a Home Valuation Report for This Property
The Home Valuation Report is an in-depth analysis detailing your home's value as well as a comparison with similar homes in the area
Home Values in the Area
Average Home Value in this Area
Purchase History
| Date | Buyer | Sale Price | Title Company |
|---|---|---|---|
| Smith Terrill L | -- | Indecomm Global Services | |
| Homestar Bk & Fincl Svcs | -- | Chicago Title Insurance Co |
Source: Public Records
Mortgage History
| Date | Status | Borrower | Loan Amount |
|---|---|---|---|
| Previous Owner | Smith Terrill L | $118,000 |
Source: Public Records
Tax History Compared to Growth
Tax History
| Year | Tax Paid | Tax Assessment Tax Assessment Total Assessment is a certain percentage of the fair market value that is determined by local assessors to be the total taxable value of land and additions on the property. | Land | Improvement |
|---|---|---|---|---|
| 2024 | $2,221 | $7,000 | $1,220 | $5,780 |
| 2023 | $289 | $7,000 | $1,220 | $5,780 |
| 2022 | $289 | $3,822 | $1,068 | $2,754 |
| 2021 | $362 | $3,820 | $1,067 | $2,753 |
| 2020 | $494 | $3,820 | $1,067 | $2,753 |
| 2019 | $751 | $4,468 | $991 | $3,477 |
| 2018 | $736 | $4,468 | $991 | $3,477 |
| 2017 | $750 | $4,468 | $991 | $3,477 |
| 2016 | $1,254 | $4,286 | $915 | $3,371 |
| 2015 | $1,856 | $4,286 | $915 | $3,371 |
| 2014 | $1,872 | $4,286 | $915 | $3,371 |
| 2013 | $2,102 | $5,026 | $915 | $4,111 |
Source: Public Records
Map
Nearby Homes