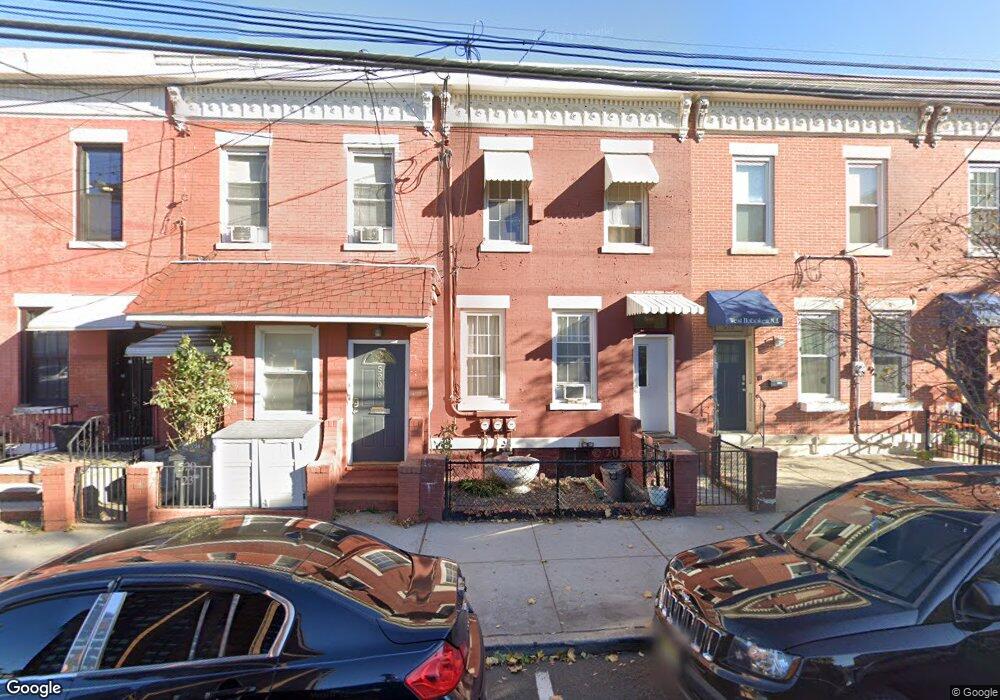
518 23rd St Union City, NJ 07087
Estimated Value: $614,000 - $845,000
2
Beds
--
Bath
1,584
Sq Ft
$448/Sq Ft
Est. Value
About This Home
This home is located at 518 23rd St, Union City, NJ 07087 and is currently estimated at $709,846, approximately $448 per square foot. 518 23rd St is a home located in Hudson County with nearby schools including Robert Waters School, Sara M. Gilmore Academy, and Jose Marti Freshman Academy.
Ownership History
Date
Name
Owned For
Owner Type
Purchase Details
Closed on
Feb 12, 1999
Sold by
Rodriguez Sabina and Nunez Onesimo A
Bought by
Nunez Onesimo A and Nunez Ana B
Current Estimated Value
Home Financials for this Owner
Home Financials are based on the most recent Mortgage that was taken out on this home.
Original Mortgage
$87,000
Outstanding Balance
$20,592
Interest Rate
6.74%
Mortgage Type
Purchase Money Mortgage
Estimated Equity
$689,254
Purchase Details
Closed on
Nov 15, 1994
Sold by
Dragona Anthony and Dragona Sandy
Bought by
Rodriguez Sabina and Nunez Onesimo A
Create a Home Valuation Report for This Property
The Home Valuation Report is an in-depth analysis detailing your home's value as well as a comparison with similar homes in the area
Home Values in the Area
Average Home Value in this Area
Purchase History
| Date | Buyer | Sale Price | Title Company |
|---|---|---|---|
| Nunez Onesimo A | -- | -- | |
| Rodriguez Sabina | $87,550 | -- |
Source: Public Records
Mortgage History
| Date | Status | Borrower | Loan Amount |
|---|---|---|---|
| Open | Nunez Onesimo A | $87,000 |
Source: Public Records
Tax History Compared to Growth
Tax History
| Year | Tax Paid | Tax Assessment Tax Assessment Total Assessment is a certain percentage of the fair market value that is determined by local assessors to be the total taxable value of land and additions on the property. | Land | Improvement |
|---|---|---|---|---|
| 2025 | $11,979 | $581,200 | $241,900 | $339,300 |
| 2024 | $8,072 | $648,200 | $235,800 | $412,400 |
| 2023 | $8,072 | $105,000 | $64,500 | $40,500 |
| 2022 | $7,782 | $105,000 | $64,500 | $40,500 |
| 2021 | $7,754 | $105,000 | $64,500 | $40,500 |
| 2020 | $7,666 | $105,000 | $64,500 | $40,500 |
| 2019 | $7,458 | $105,000 | $64,500 | $40,500 |
| 2018 | $7,319 | $105,000 | $64,500 | $40,500 |
| 2017 | $7,249 | $105,000 | $64,500 | $40,500 |
| 2016 | $7,235 | $105,000 | $64,500 | $40,500 |
| 2015 | $7,110 | $105,000 | $64,500 | $40,500 |
| 2014 | $6,955 | $105,000 | $64,500 | $40,500 |
Source: Public Records
Map
Nearby Homes