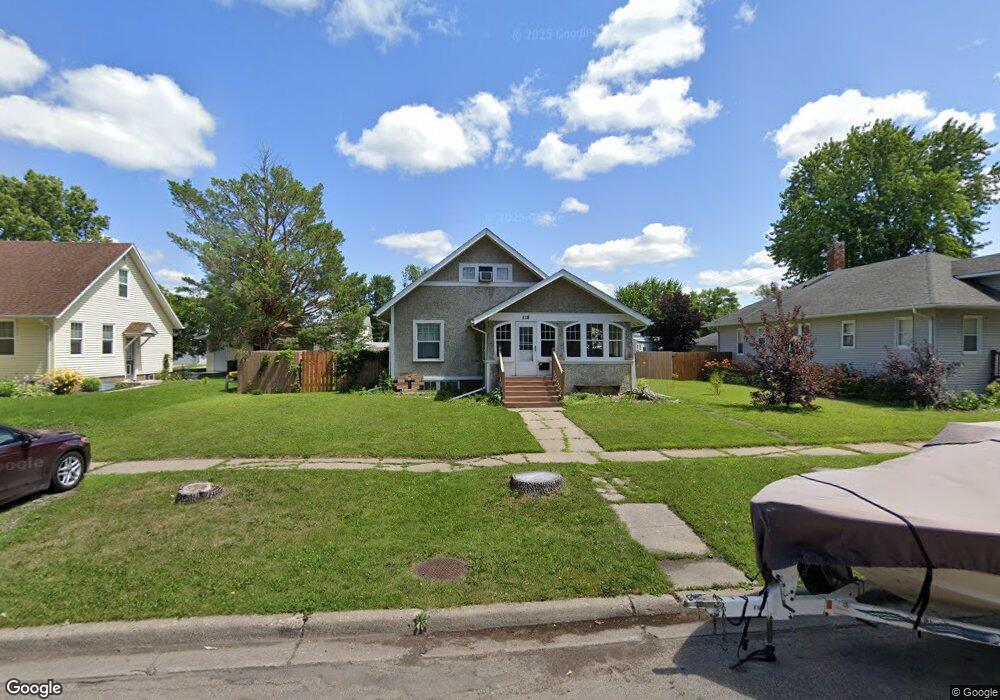
518 3rd St N Wahpeton, ND 58075
Estimated Value: $113,000 - $189,632
4
Beds
1
Bath
2,696
Sq Ft
$56/Sq Ft
Est. Value
About This Home
This home is located at 518 3rd St N, Wahpeton, ND 58075 and is currently estimated at $151,658, approximately $56 per square foot. 518 3rd St N is a home located in Richland County with nearby schools including Zimmerman Elementary School, Wahpeton Elementary School, and Wahpeton Middle School.
Ownership History
Date
Name
Owned For
Owner Type
Purchase Details
Closed on
Nov 15, 2021
Sold by
Henrickson Wayne R
Bought by
Henrickson Wayne R
Current Estimated Value
Purchase Details
Closed on
Nov 12, 2020
Sold by
Sestak Miller Rebecca K
Bought by
Henrickson Wayne R
Home Financials for this Owner
Home Financials are based on the most recent Mortgage that was taken out on this home.
Original Mortgage
$102,525
Interest Rate
2.8%
Mortgage Type
New Conventional
Create a Home Valuation Report for This Property
The Home Valuation Report is an in-depth analysis detailing your home's value as well as a comparison with similar homes in the area
Home Values in the Area
Average Home Value in this Area
Purchase History
| Date | Buyer | Sale Price | Title Company |
|---|---|---|---|
| Henrickson Wayne R | -- | None Listed On Document | |
| Henrickson Wayne R | $101,500 | Innovative Abstract & Ttl Co |
Source: Public Records
Mortgage History
| Date | Status | Borrower | Loan Amount |
|---|---|---|---|
| Previous Owner | Henrickson Wayne R | $102,525 |
Source: Public Records
Tax History Compared to Growth
Tax History
| Year | Tax Paid | Tax Assessment Tax Assessment Total Assessment is a certain percentage of the fair market value that is determined by local assessors to be the total taxable value of land and additions on the property. | Land | Improvement |
|---|---|---|---|---|
| 2024 | $1,847 | $58,700 | $12,300 | $46,400 |
| 2023 | $1,732 | $54,300 | $7,900 | $46,400 |
| 2022 | $1,646 | $52,200 | $7,900 | $44,300 |
| 2021 | $1,553 | $47,900 | $7,900 | $40,000 |
| 2020 | $1,229 | $37,400 | $7,900 | $29,500 |
| 2019 | $1,185 | $36,000 | $7,900 | $28,100 |
| 2018 | $1,176 | $35,300 | $7,900 | $27,400 |
| 2017 | $1,168 | $34,250 | $7,900 | $26,350 |
| 2016 | $1,032 | $32,950 | $7,900 | $25,050 |
| 2015 | -- | $2,966 | $0 | $0 |
| 2014 | -- | $2,858 | $0 | $0 |
| 2013 | -- | $2,817 | $0 | $0 |
Source: Public Records
Map
Nearby Homes