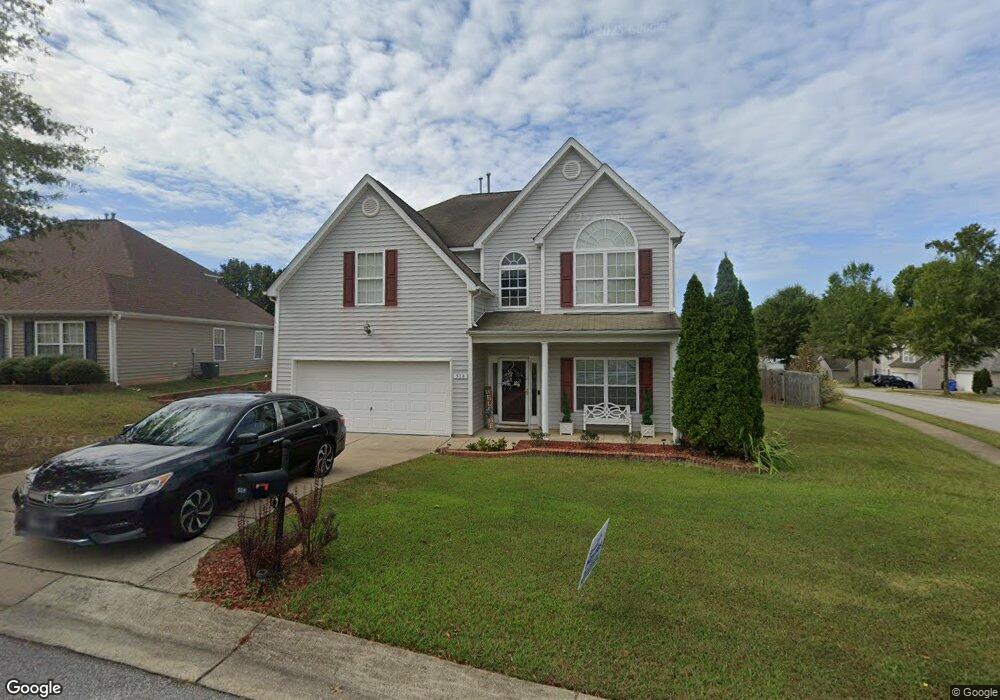
518 Birchwood View Point Fuquay Varina, NC 27526
Estimated Value: $407,000 - $447,000
--
Bed
3
Baths
2,542
Sq Ft
$167/Sq Ft
Est. Value
About This Home
This home is located at 518 Birchwood View Point, Fuquay Varina, NC 27526 and is currently estimated at $425,065, approximately $167 per square foot. 518 Birchwood View Point is a home located in Wake County with nearby schools including Fuquay-Varina High, Achievement Charter Academy, and Southern Wake Academy.
Ownership History
Date
Name
Owned For
Owner Type
Purchase Details
Closed on
Apr 25, 2017
Sold by
Meadows Wilbert and Meadows Gwendolyn
Bought by
Thornton Gwendolyn
Current Estimated Value
Home Financials for this Owner
Home Financials are based on the most recent Mortgage that was taken out on this home.
Original Mortgage
$164,490
Outstanding Balance
$136,542
Interest Rate
4.12%
Mortgage Type
FHA
Estimated Equity
$288,523
Purchase Details
Closed on
Aug 25, 2006
Sold by
Homelife Communities Of Raleigh Inc
Bought by
Meadows Wilbert and Meadows Gwendolyn
Home Financials for this Owner
Home Financials are based on the most recent Mortgage that was taken out on this home.
Original Mortgage
$42,825
Interest Rate
6.67%
Mortgage Type
Stand Alone Second
Create a Home Valuation Report for This Property
The Home Valuation Report is an in-depth analysis detailing your home's value as well as a comparison with similar homes in the area
Home Values in the Area
Average Home Value in this Area
Purchase History
| Date | Buyer | Sale Price | Title Company |
|---|---|---|---|
| Thornton Gwendolyn | -- | None Available | |
| Meadows Wilbert | $214,500 | None Available |
Source: Public Records
Mortgage History
| Date | Status | Borrower | Loan Amount |
|---|---|---|---|
| Open | Thornton Gwendolyn | $164,490 | |
| Previous Owner | Meadows Wilbert | $42,825 | |
| Previous Owner | Meadows Wilbert | $171,315 |
Source: Public Records
Tax History Compared to Growth
Tax History
| Year | Tax Paid | Tax Assessment Tax Assessment Total Assessment is a certain percentage of the fair market value that is determined by local assessors to be the total taxable value of land and additions on the property. | Land | Improvement |
|---|---|---|---|---|
| 2025 | $3,736 | $424,652 | $85,000 | $339,652 |
| 2024 | $3,721 | $424,652 | $85,000 | $339,652 |
| 2023 | $2,905 | $259,472 | $55,000 | $204,472 |
| 2022 | $2,730 | $259,472 | $55,000 | $204,472 |
| 2021 | $2,602 | $259,472 | $55,000 | $204,472 |
| 2020 | $2,602 | $259,472 | $55,000 | $204,472 |
| 2019 | $2,455 | $211,167 | $46,000 | $165,167 |
| 2018 | $2,315 | $211,167 | $46,000 | $165,167 |
| 2017 | $2,232 | $211,167 | $46,000 | $165,167 |
| 2016 | $2,201 | $211,167 | $46,000 | $165,167 |
| 2015 | $2,043 | $202,377 | $38,000 | $164,377 |
| 2014 | $1,969 | $202,377 | $38,000 | $164,377 |
Source: Public Records
Map
Nearby Homes
- 513 Aspen Grove Dr
- 509 Timber Meadow Lake Dr
- 848 Red Oak Tree Dr
- 610 Silk Tree Trace
- 1036 Steelhorse Dr
- 904 Bridlemine Dr
- 925 Arnold Place Dr
- 633 Prickly Pear Dr
- 909 Sunset Dr
- 1114 Bridlemine Dr
- 1050 Wagstaff Rd
- 1000 Wagstaff Rd
- 817 Stable Fern Dr
- 837 Stable Fern Dr
- 200 Old Spring Hill Ln
- 70 Saintsbury Dr
- 56 Saintsbury Dr
- 857 Stable Fern Dr
- 1612 S Main St
- 1113 Matisse Dr
- 514 Birchwood View Point
- 514 Birchwood View
- 517 Aspen Grove Dr
- 509 Aspen Grove Dr
- 508 Birchwood View Point
- 508 Birchwood View Ct
- 508 Birchwood View
- 716 Red Oak Tree Dr
- 712 Red Oak Tree Dr
- 720 Red Oak Tree Dr
- 517 Birchwood View
- 517 Birchwood View Point
- 708 Red Oak Tree Dr
- 505 Aspen Grove Dr
- 724 Red Oak Tree Dr
- 513 Birchwood View
- 513 Birchwood View Point
- 734 Willow Bay Dr
- 730 Willow Bay Dr
- 738 Willow Bay Dr