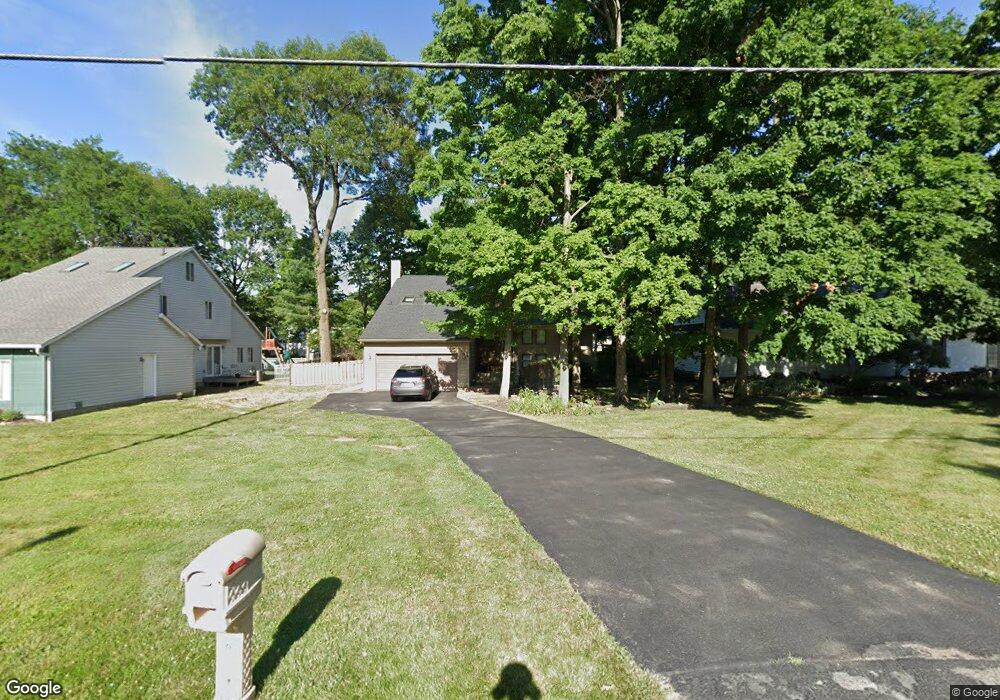
518 Clotts Rd Columbus, OH 43230
Estimated Value: $382,430 - $426,000
3
Beds
3
Baths
1,858
Sq Ft
$218/Sq Ft
Est. Value
About This Home
This home is located at 518 Clotts Rd, Columbus, OH 43230 and is currently estimated at $405,858, approximately $218 per square foot. 518 Clotts Rd is a home located in Franklin County with nearby schools including High Point Elementary School, Gahanna East Middle School, and Lincoln High School.
Ownership History
Date
Name
Owned For
Owner Type
Purchase Details
Closed on
Jul 29, 2005
Sold by
Swartz Stephanie
Bought by
Ressing Tanya J
Current Estimated Value
Home Financials for this Owner
Home Financials are based on the most recent Mortgage that was taken out on this home.
Original Mortgage
$234,000
Outstanding Balance
$123,318
Interest Rate
5.71%
Mortgage Type
Purchase Money Mortgage
Estimated Equity
$282,540
Purchase Details
Closed on
Oct 29, 1999
Sold by
Gitman Simona S
Bought by
Swartz Stephanie
Purchase Details
Closed on
Mar 3, 1997
Sold by
Truax Lawrence E
Bought by
Simona S Gitman
Home Financials for this Owner
Home Financials are based on the most recent Mortgage that was taken out on this home.
Original Mortgage
$137,250
Interest Rate
7.75%
Mortgage Type
New Conventional
Purchase Details
Closed on
Aug 2, 1988
Purchase Details
Closed on
Nov 1, 1986
Create a Home Valuation Report for This Property
The Home Valuation Report is an in-depth analysis detailing your home's value as well as a comparison with similar homes in the area
Home Values in the Area
Average Home Value in this Area
Purchase History
| Date | Buyer | Sale Price | Title Company |
|---|---|---|---|
| Ressing Tanya J | $232,000 | Hummel Titl | |
| Swartz Stephanie | $176,000 | Peterson Title Agency | |
| Simona S Gitman | $152,500 | -- | |
| -- | $140,000 | -- | |
| -- | $17,300 | -- |
Source: Public Records
Mortgage History
| Date | Status | Borrower | Loan Amount |
|---|---|---|---|
| Open | Ressing Tanya J | $234,000 | |
| Previous Owner | Simona S Gitman | $137,250 |
Source: Public Records
Tax History Compared to Growth
Tax History
| Year | Tax Paid | Tax Assessment Tax Assessment Total Assessment is a certain percentage of the fair market value that is determined by local assessors to be the total taxable value of land and additions on the property. | Land | Improvement |
|---|---|---|---|---|
| 2024 | $13,442 | $103,570 | $8,400 | $95,170 |
| 2023 | $6,025 | $103,565 | $8,400 | $95,165 |
| 2022 | $8,675 | $77,950 | $6,060 | $71,890 |
| 2021 | $5,630 | $77,950 | $6,060 | $71,890 |
| 2020 | $5,583 | $77,950 | $6,060 | $71,890 |
| 2019 | $4,670 | $65,070 | $5,040 | $60,030 |
| 2018 | $4,833 | $65,070 | $5,040 | $60,030 |
| 2017 | $4,286 | $65,070 | $5,040 | $60,030 |
| 2016 | $5,025 | $69,480 | $11,800 | $57,680 |
| 2015 | $5,029 | $69,480 | $11,800 | $57,680 |
| 2014 | $4,991 | $69,480 | $11,800 | $57,680 |
| 2013 | $2,458 | $68,915 | $11,235 | $57,680 |
Source: Public Records
Map
Nearby Homes
- 657 Picadilly Ct
- 641 Sycamore Mill Dr
- 477 Stratshire Ln
- 365 Sycamore Woods Ln Unit 365
- 302 Zander Ln Unit 302
- 804 Riva Ridge Blvd
- 638 Churchill Dr
- 219 N Hamilton Rd
- 211 Crossing Creek N
- 488 Three Oaks Ct Unit 488
- 4220 E Johnstown Rd
- 206 Lintner St
- 900 Old Pine Dr
- 0 Beecher Crossing
- 777 Dark Star Ave
- 107 Kinder Place
- 108 Walcreek Dr W
- 745 Fleetrun Ave
- 1035 Riva Ridge Blvd
- 148 Sierra Dr