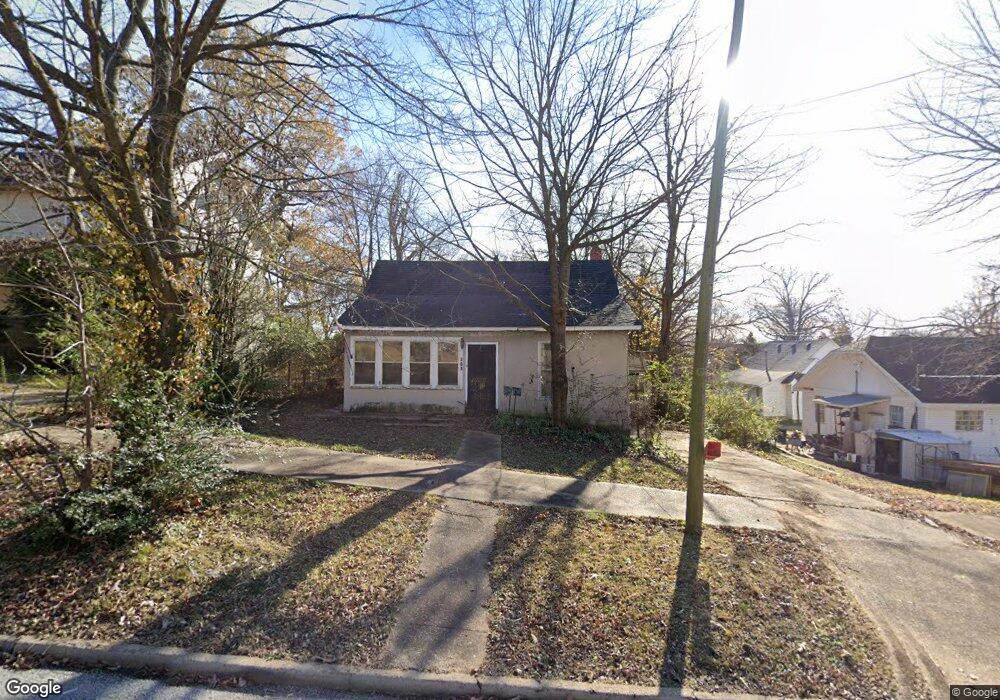
518 Cynthia St Poplar Bluff, MO 63901
Estimated Value: $42,000 - $80,000
--
Bed
--
Bath
1,499
Sq Ft
$43/Sq Ft
Est. Value
About This Home
This home is located at 518 Cynthia St, Poplar Bluff, MO 63901 and is currently estimated at $64,003, approximately $42 per square foot. 518 Cynthia St is a home with nearby schools including Poplar Bluff Fifth & Sixth Grade Center, Lake Road Elementary School, and Poplar Bluff Junior High School.
Ownership History
Date
Name
Owned For
Owner Type
Purchase Details
Closed on
Apr 25, 2017
Sold by
Jackson Terry Wayne and Jackson Ruth
Bought by
Brannum Dennis and Brannum Donna Marie
Current Estimated Value
Home Financials for this Owner
Home Financials are based on the most recent Mortgage that was taken out on this home.
Original Mortgage
$64,464
Outstanding Balance
$53,800
Interest Rate
4.23%
Mortgage Type
Future Advance Clause Open End Mortgage
Estimated Equity
$10,203
Purchase Details
Closed on
Aug 25, 2009
Sold by
Schrage Jamie
Bought by
T J S Builders Llc
Create a Home Valuation Report for This Property
The Home Valuation Report is an in-depth analysis detailing your home's value as well as a comparison with similar homes in the area
Home Values in the Area
Average Home Value in this Area
Purchase History
| Date | Buyer | Sale Price | Title Company |
|---|---|---|---|
| Brannum Dennis | -- | None Available | |
| T J S Builders Llc | -- | -- |
Source: Public Records
Mortgage History
| Date | Status | Borrower | Loan Amount |
|---|---|---|---|
| Open | Brannum Dennis | $64,464 |
Source: Public Records
Tax History Compared to Growth
Tax History
| Year | Tax Paid | Tax Assessment Tax Assessment Total Assessment is a certain percentage of the fair market value that is determined by local assessors to be the total taxable value of land and additions on the property. | Land | Improvement |
|---|---|---|---|---|
| 2024 | $3 | $5,870 | $0 | $0 |
| 2023 | $284 | $5,870 | $0 | $0 |
| 2022 | $275 | $5,710 | $0 | $0 |
| 2021 | $275 | $5,710 | $0 | $0 |
| 2020 | $272 | $5,570 | $0 | $0 |
| 2019 | $272 | $5,570 | $0 | $0 |
| 2018 | $272 | $5,570 | $0 | $0 |
| 2017 | -- | $5,570 | $0 | $0 |
| 2016 | -- | $5,570 | $0 | $0 |
| 2015 | -- | $5,570 | $0 | $0 |
| 2014 | -- | $5,240 | $0 | $0 |
| 2012 | $223 | $5,240 | $0 | $0 |
Source: Public Records
Map
Nearby Homes