Estimated Value: $559,000 - $611,000
--
Bed
32
Baths
10,402
Sq Ft
$56/Sq Ft
Est. Value
About This Home
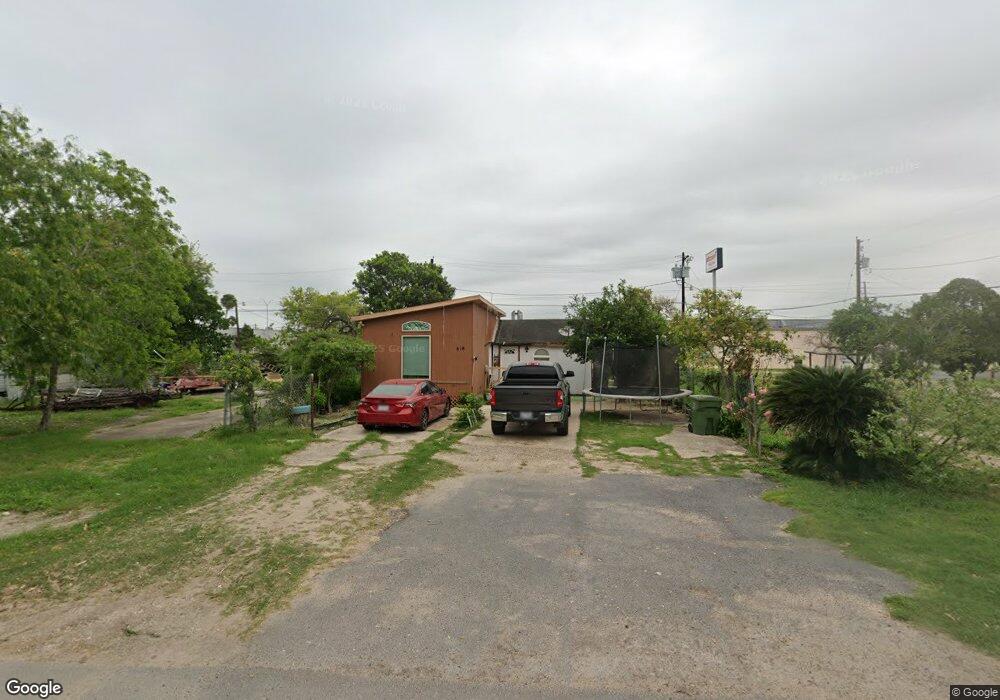
This home is located at 518 Ebony, Alamo, TX 78516 and is currently estimated at $585,000, approximately $56 per square foot. 518 Ebony is a home located in Hidalgo County with nearby schools including Zeferino Farias Elementary School, Jesus "Jesse" Vela Jr. Middle School, and PSJA Memorial Early College High School.
Ownership History
Date
Name
Owned For
Owner Type
Purchase Details
Closed on
Sep 13, 2023
Sold by
Genesis C Investments Llc
Bought by
Ortiz Eduardo
Current Estimated Value
Home Financials for this Owner
Home Financials are based on the most recent Mortgage that was taken out on this home.
Original Mortgage
$608,000
Outstanding Balance
$594,376
Interest Rate
6.9%
Mortgage Type
VA
Estimated Equity
-$9,376
Purchase Details
Closed on
Oct 25, 2022
Sold by
Salinas Juan
Bought by
Genesis C Investments Llc
Home Financials for this Owner
Home Financials are based on the most recent Mortgage that was taken out on this home.
Original Mortgage
$440,400
Interest Rate
6.7%
Mortgage Type
Construction
Purchase Details
Closed on
Dec 23, 2008
Sold by
Castillo Francisco and Pharr San Juan Alamo Independe
Bought by
Salinas Juan
Create a Home Valuation Report for This Property
The Home Valuation Report is an in-depth analysis detailing your home's value as well as a comparison with similar homes in the area
Home Values in the Area
Average Home Value in this Area
Purchase History
| Date | Buyer | Sale Price | Title Company |
|---|---|---|---|
| Ortiz Eduardo | -- | Corporation Service | |
| Genesis C Investments Llc | -- | Corporation Service | |
| Salinas Juan | $22,600 | None Available |
Source: Public Records
Mortgage History
| Date | Status | Borrower | Loan Amount |
|---|---|---|---|
| Open | Ortiz Eduardo | $608,000 | |
| Previous Owner | Genesis C Investments Llc | $440,400 |
Source: Public Records
Tax History Compared to Growth
Tax History
| Year | Tax Paid | Tax Assessment Tax Assessment Total Assessment is a certain percentage of the fair market value that is determined by local assessors to be the total taxable value of land and additions on the property. | Land | Improvement |
|---|---|---|---|---|
| 2025 | $10,987 | $870,041 | -- | -- |
| 2024 | $10,987 | $622,327 | $70,400 | $551,927 |
| 2023 | $1,536 | $61,600 | $61,600 | $0 |
| 2022 | $1,028 | $38,500 | $38,500 | $0 |
| 2021 | $1,047 | $38,500 | $38,500 | $0 |
| 2020 | $910 | $33,000 | $33,000 | $0 |
| 2019 | $787 | $27,500 | $27,500 | $0 |
| 2018 | $785 | $27,500 | $27,500 | $0 |
| 2017 | $797 | $27,500 | $27,500 | $0 |
| 2016 | $638 | $22,000 | $22,000 | $0 |
| 2015 | $633 | $22,000 | $22,000 | $0 |
Source: Public Records
Map
Nearby Homes
- 717 Nora Cir
- 83 E Frontage Rd
- 703 N 7th St
- 804 E Frontage Rd
- 503 Shea Dr
- 721 Saint Vincent Dr Unit 12
- 721 Saint Vincent Dr
- 824 E Frontage Rd
- 432 Acacia St
- 428 Acacia St
- 831 W Hackberry Ave
- 735 Saint Vincent Dr
- 738 Saint Vincent Dr
- 719 N Margret St
- 607 N 9th St
- 346 E Windmill Palm St
- 538 Tulip Cir
- 344 Windmill Palm St
- 416 E Acacia Ave
- 412 E Acacia Ave