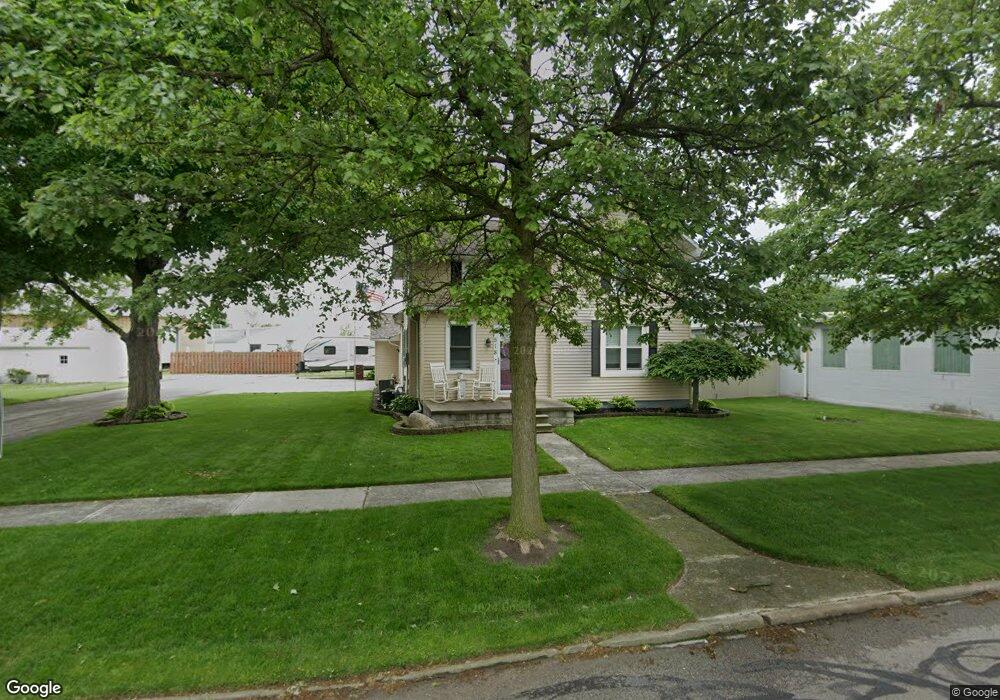
518 Fremont St Elmore, OH 43416
Estimated Value: $191,000 - $204,000
3
Beds
2
Baths
1,841
Sq Ft
$106/Sq Ft
Est. Value
About This Home
This home is located at 518 Fremont St, Elmore, OH 43416 and is currently estimated at $194,415, approximately $105 per square foot. 518 Fremont St is a home located in Ottawa County with nearby schools including Woodmore Elementary School and Woodmore Middle School.
Ownership History
Date
Name
Owned For
Owner Type
Purchase Details
Closed on
Jul 31, 2016
Sold by
Koskoski Jarrod Francis and Koskoski Chrsitine E
Bought by
Dunlap Adam R and Dunlap Brandy Z
Current Estimated Value
Home Financials for this Owner
Home Financials are based on the most recent Mortgage that was taken out on this home.
Original Mortgage
$106,940
Outstanding Balance
$85,326
Interest Rate
3.48%
Mortgage Type
New Conventional
Estimated Equity
$109,089
Purchase Details
Closed on
May 31, 2005
Sold by
Murray Michael David
Bought by
Koskoski Jarrod Francis and Koskoski Christine E
Home Financials for this Owner
Home Financials are based on the most recent Mortgage that was taken out on this home.
Original Mortgage
$81,000
Interest Rate
7.1%
Mortgage Type
Fannie Mae Freddie Mac
Create a Home Valuation Report for This Property
The Home Valuation Report is an in-depth analysis detailing your home's value as well as a comparison with similar homes in the area
Home Values in the Area
Average Home Value in this Area
Purchase History
| Date | Buyer | Sale Price | Title Company |
|---|---|---|---|
| Dunlap Adam R | $100,150 | Attorney | |
| Koskoski Jarrod Francis | $90,000 | -- |
Source: Public Records
Mortgage History
| Date | Status | Borrower | Loan Amount |
|---|---|---|---|
| Open | Dunlap Adam R | $106,940 | |
| Previous Owner | Koskoski Jarrod Francis | $81,000 |
Source: Public Records
Tax History Compared to Growth
Tax History
| Year | Tax Paid | Tax Assessment Tax Assessment Total Assessment is a certain percentage of the fair market value that is determined by local assessors to be the total taxable value of land and additions on the property. | Land | Improvement |
|---|---|---|---|---|
| 2024 | $2,546 | $48,143 | $8,883 | $39,260 |
| 2023 | $2,546 | $41,311 | $6,580 | $34,731 |
| 2022 | $2,362 | $41,311 | $6,580 | $34,731 |
| 2021 | $2,379 | $41,310 | $6,580 | $34,730 |
| 2020 | $2,189 | $36,040 | $6,580 | $29,460 |
| 2019 | $2,161 | $36,040 | $6,580 | $29,460 |
| 2018 | $2,136 | $36,040 | $6,580 | $29,460 |
| 2017 | $1,833 | $30,730 | $6,580 | $24,150 |
| 2016 | $1,792 | $30,730 | $6,580 | $24,150 |
| 2015 | $1,906 | $30,730 | $6,580 | $24,150 |
| 2014 | $1,878 | $29,420 | $6,580 | $22,840 |
| 2013 | $1,883 | $29,420 | $6,580 | $22,840 |
Source: Public Records
Map
Nearby Homes
- 0 W Portage River Rd S Unit 6130453
- 20240 W Portage River South Rd
- 19383 Courtland Ave
- 620 Water St
- 6201 County Highway 165
- 212 S Perry St
- 219 Lime St
- 2574 County Road 74
- 612 W Main St
- 739 Riverside Dr
- 421 Parklane Dr
- 571 Parklane Dr
- 205 W 4th St
- 514 West St
- 14878 W State Route 163
- 904 Main St
- 207 E 11th St
- 1350 N Genoa Clay Center Rd
- 510 Wilson St
- 1861 N Opfer-Lentz Rd