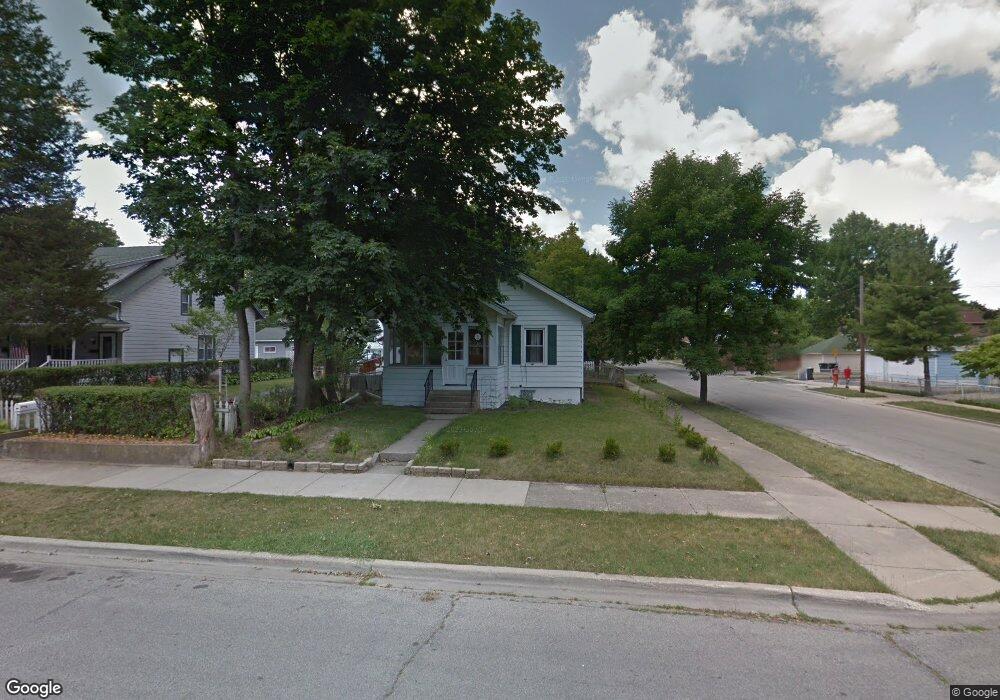
518 Judge Ave Waukegan, IL 60085
Lorraine Terrace NeighborhoodEstimated Value: $183,000 - $237,000
2
Beds
1
Bath
912
Sq Ft
$222/Sq Ft
Est. Value
About This Home
This home is located at 518 Judge Ave, Waukegan, IL 60085 and is currently estimated at $202,790, approximately $222 per square foot. 518 Judge Ave is a home located in Lake County with nearby schools including Hyde Park Elementary School, Miguel Juarez Middle School, and Waukegan High School.
Ownership History
Date
Name
Owned For
Owner Type
Purchase Details
Closed on
Feb 22, 2011
Sold by
Tcf National Bank
Bought by
Orduna Rodolfo
Current Estimated Value
Home Financials for this Owner
Home Financials are based on the most recent Mortgage that was taken out on this home.
Original Mortgage
$66,405
Outstanding Balance
$45,590
Interest Rate
4.85%
Mortgage Type
Seller Take Back
Estimated Equity
$157,200
Purchase Details
Closed on
Oct 26, 2010
Sold by
Petrick Mark and Case #10 Ch 645
Bought by
Tcf National Bank
Purchase Details
Closed on
Apr 7, 1995
Sold by
Pierce Ray Bonnie Jean and Pierce Ray Bonnie Jean
Bought by
Petrick Mark R and Petrick Ramona M
Home Financials for this Owner
Home Financials are based on the most recent Mortgage that was taken out on this home.
Original Mortgage
$66,050
Interest Rate
8.55%
Mortgage Type
FHA
Create a Home Valuation Report for This Property
The Home Valuation Report is an in-depth analysis detailing your home's value as well as a comparison with similar homes in the area
Home Values in the Area
Average Home Value in this Area
Purchase History
| Date | Buyer | Sale Price | Title Company |
|---|---|---|---|
| Orduna Rodolfo | $70,000 | Stewart Title Company | |
| Tcf National Bank | -- | None Available | |
| Petrick Mark R | $55,000 | -- |
Source: Public Records
Mortgage History
| Date | Status | Borrower | Loan Amount |
|---|---|---|---|
| Open | Orduna Rodolfo | $66,405 | |
| Previous Owner | Petrick Mark R | $66,050 |
Source: Public Records
Tax History Compared to Growth
Tax History
| Year | Tax Paid | Tax Assessment Tax Assessment Total Assessment is a certain percentage of the fair market value that is determined by local assessors to be the total taxable value of land and additions on the property. | Land | Improvement |
|---|---|---|---|---|
| 2024 | $3,115 | $45,835 | $8,628 | $37,207 |
| 2023 | $3,115 | $41,037 | $7,725 | $33,312 |
| 2022 | $2,841 | $35,063 | $7,042 | $28,021 |
| 2021 | $2,575 | $30,695 | $6,633 | $24,062 |
| 2020 | $2,561 | $28,596 | $6,179 | $22,417 |
| 2019 | $2,525 | $26,204 | $5,662 | $20,542 |
| 2018 | $2,251 | $23,792 | $6,679 | $17,113 |
| 2017 | $2,141 | $21,049 | $5,909 | $15,140 |
| 2016 | $1,899 | $18,291 | $5,135 | $13,156 |
| 2015 | $1,752 | $16,371 | $4,596 | $11,775 |
| 2014 | $2,153 | $18,263 | $4,345 | $13,918 |
| 2012 | $2,888 | $19,785 | $4,707 | $15,078 |
Source: Public Records
Map
Nearby Homes
- 1213 Grand Ave
- 824 N Butrick St
- 132 Dorchester Ct
- 2115 Lydia St
- 615 Tiffany Dr
- 1416 Hamilton Ct
- 1109 Massena Ave
- 968 Judge Ave
- 1000 Pine St
- 1005 N Lewis Ave
- 917 N Linden Ave
- 1023 N Elmwood Ave
- 511 Chestnut St
- 428 N Poplar St
- 1038 Indiana Ave
- 522 N Poplar St
- 23 N Jackson St
- 702 Franklin St
- 620 N Poplar St
- 1117 Judge Ave
- 514 Judge Ave
- 512 Judge Ave
- 1610 Lydia St
- 508 Judge Ave
- 530 Judge Ave
- 504 Judge Ave
- 517 Lorraine Ave
- 513 Lorraine Ave
- 509 Lorraine Ave
- 536 Judge Ave
- 432 Judge Ave
- 505 Lorraine Ave
- 521 Lorraine Ave Unit 1
- 521 Lorraine Ave Unit 2
- 525 Lorraine Ave
- 540 Judge Ave
- 501 Lorraine Ave
- 1500 Lydia St
- 515 Judge Ave
- 430 Judge Ave